

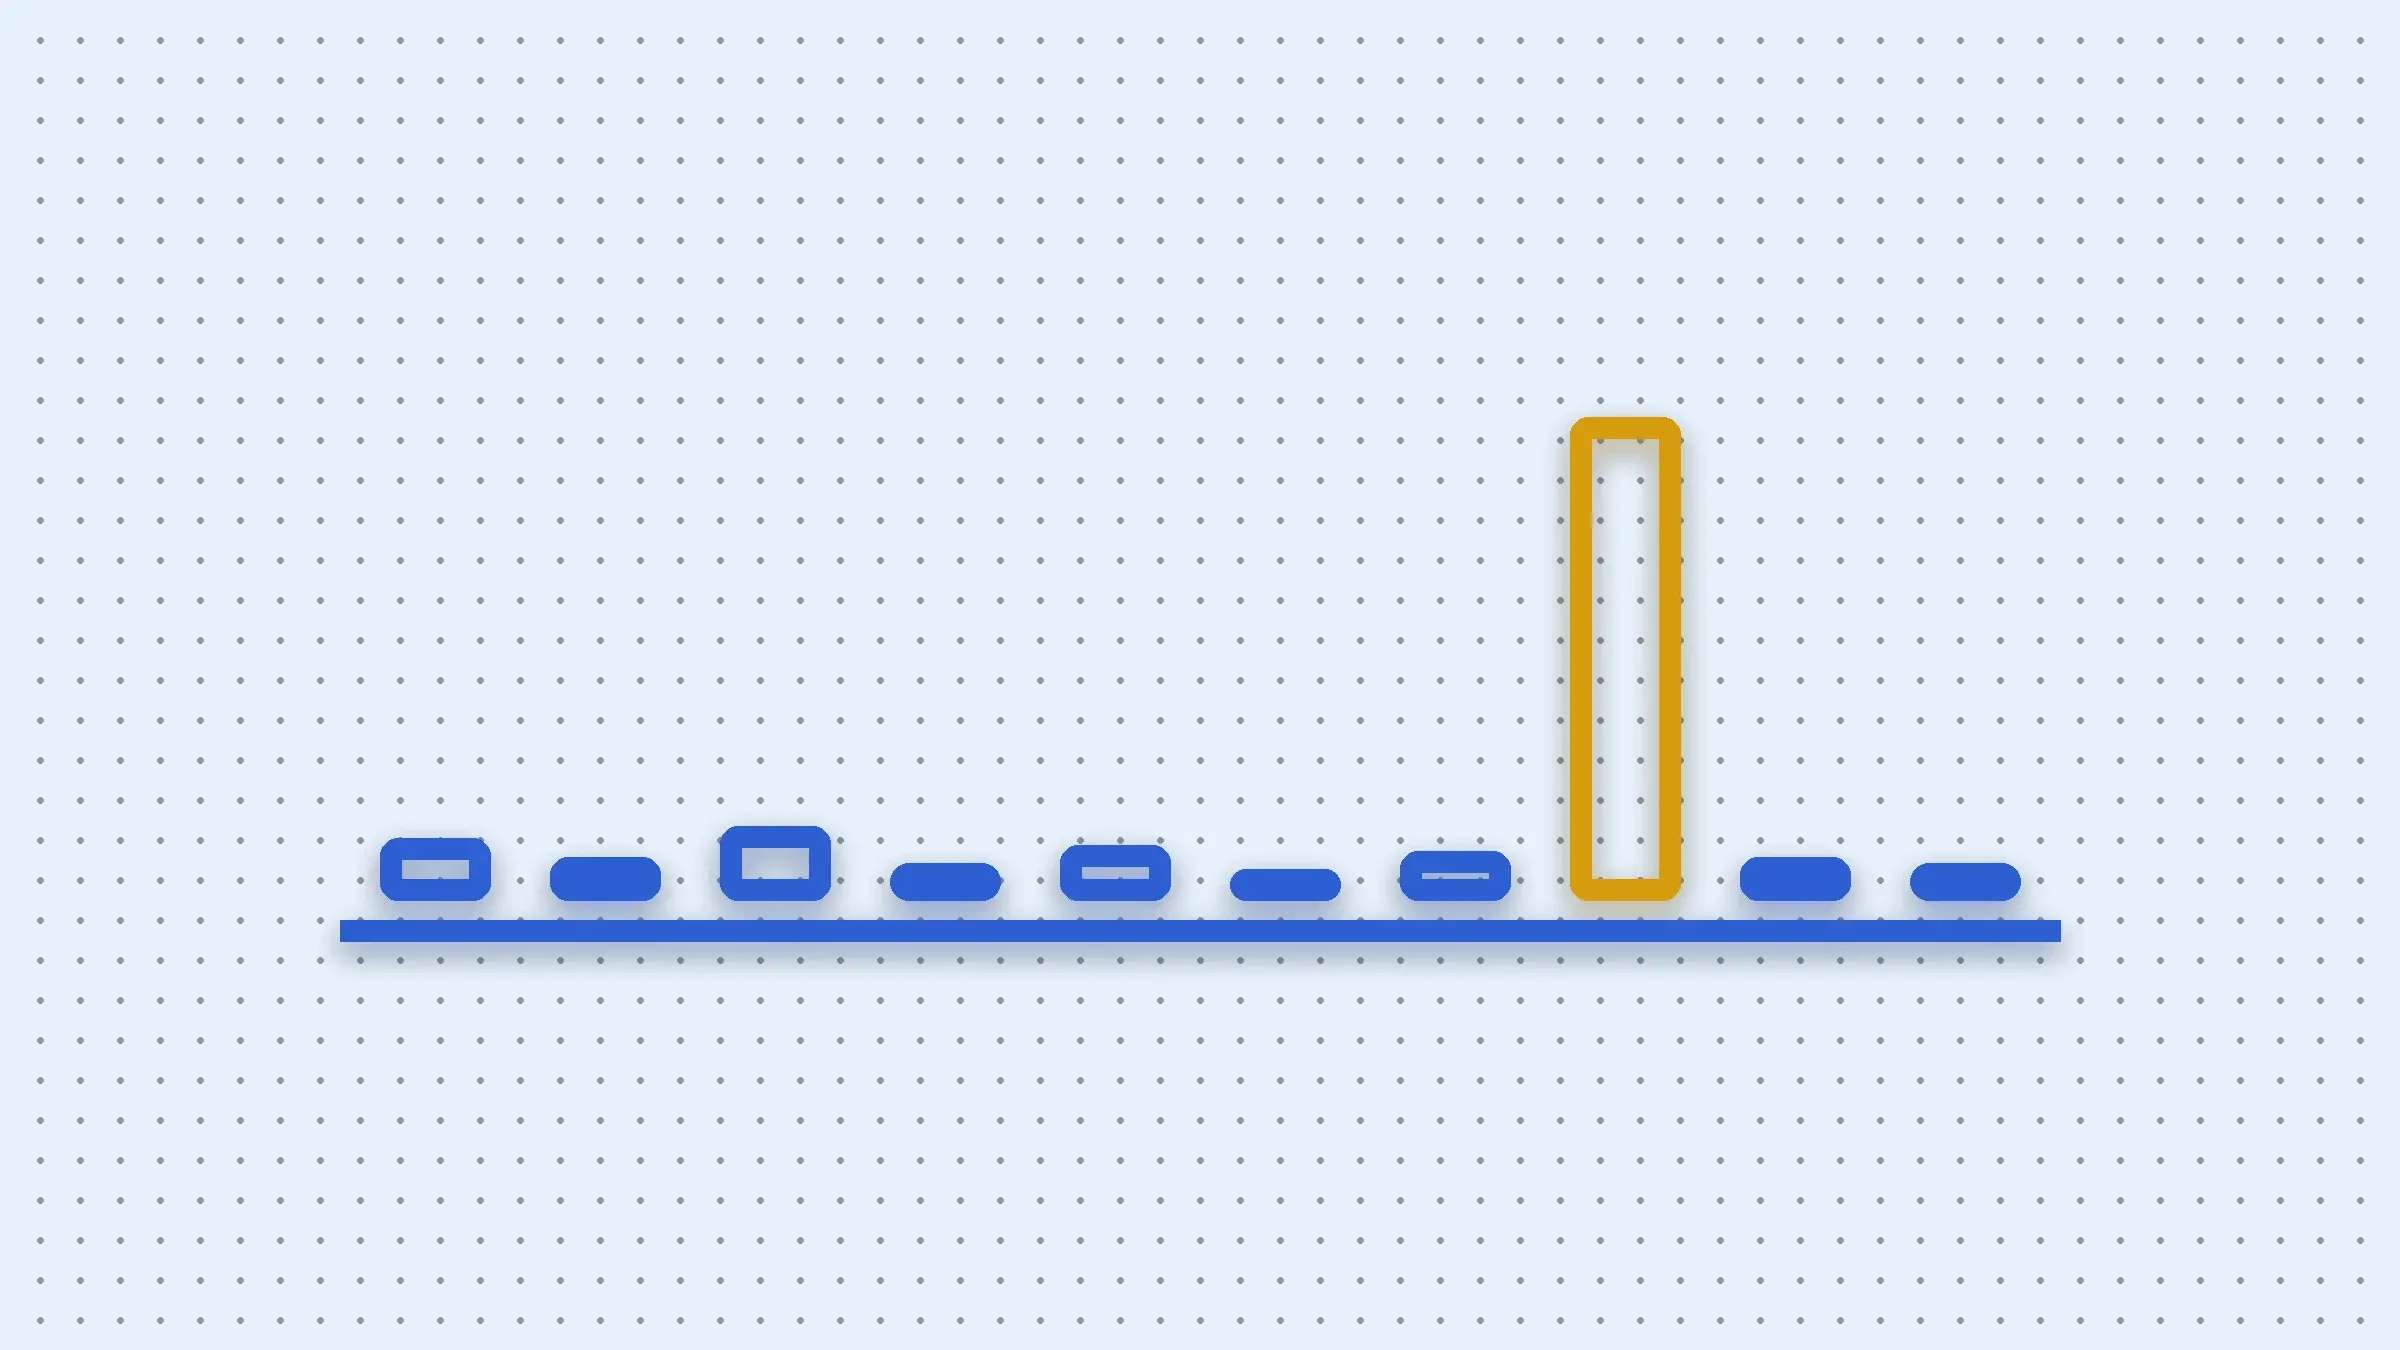
This study looks at how pages perform on 100 websites I own that have Google Search Console data. It also covers what happens to a new page in its first 90 to 180 days. Most pages get no clicks. A handful of pages get nearly all of them. Few new pages get a click within 90 days. It is written for owners and marketers who do their own SEO and want to know whether their site looks normal. The sample is my own portfolio. It describes my sites and not the web.
Median share of a site's pages with impressions that got zero clicks in 12 months (p25 to p75: 78.5% to 96.3%), n = 84 sites
Median share of a site's 12-month clicks that came from its top 10% of pages (p25 to p75: 83.5% to 100%), n = 76 sites
New pages that got a click within 90 days, pooled (1,336 of 16,046)
Queries with 10 or more impressions and an average position of 3 or better that got zero clicks in 12 months (344 of 421, 32 sites)
How big were the sites in this sample?
The median site had 74 pages with impressions in 12 months (p25 to p75: 14 to 344, n = 100). The range is wide. I show medians and ranges throughout. The middle half of sites sit between the p25 and p75 values.
I use the 84 sites with 10 or more pages with impressions for measures that need enough pages. I use the sites that had any clicks for measures that need clicks. That is why the n changes from finding to finding.
Finding 1: most pages never get a click
On my sites most pages with impressions record no clicks at all. The median site had 87.9% of its pages with impressions at zero clicks over 12 months (p25 to p75: 78.5% to 96.3%, n = 84 sites). Pooling every page together gives the same picture. 104,089 of 116,760 pages (89.1%) had zero clicks.
What this means if you run your own site: more pages did not lower the zero-click share on my sites (see Finding 7). Look for pages that have had impressions for a year and no clicks before you add pages. Decide whether to improve, merge or remove each one.
Finding 2: a handful of pages bring in nearly all the clicks
A small group of pages brings in nearly all the clicks. The median share of 12-month clicks from a site's top 10% of pages was 96.1% (p25 to p75: 83.5% to 100%, n = 76 sites with any clicks).
What this means if you run your own site: find your top 10% of pages by clicks and protect them first. Check their titles, internal links and page speed before you touch anything else. A slip on those pages puts most of your clicks at risk.
Finding 3: few new pages get a click within 90 days
Few new pages get a click in their first 90 days. The pooled figure is 8.3% of eligible new pages (1,336 of 16,046) with a click within 90 days. The median site's own figure was 4.6% (p25 to p75: 0.8% to 16.5%, n = 50 sites). The pooled figure was 7.3% with two large sites excluded.
Two large sites pull the pooled figure above the site median. I show both figures for that reason.
What this means if you run your own site: a new page without a click in its first 90 days is the usual case on my sites. It does not mean you did something wrong. Judge a batch of new pages by how many get a first click. Set your expectation near the site median rather than the pooled figure.
Finding 4: when a new page does click, the first click usually comes early
New pages that clicked within 90 days had a first click a median of 11 days after the first impression (p25 to p75: 0 to 40 days, n = 1,336). Across every new page that clicked at all before the data ended the median was 16 days (p25 to p75: 1 to 55 days, n = 1,749).
Both measures start from the first impression and not from the publish date. A page with no impression has no row in Search Console.
What this means if you run your own site: a new page that has had impressions and still has no click well past 55 days is later than three quarters of the first clicks I measured. Review its title, search intent and internal links now. Beyond day 90 I only have the thin 180-day cohort in Finding 5.
Finding 5: the 180-day numbers come from a thin cohort
7.8% (137 of 1,760) of the new pages old enough to measure at 180 days had a click. 2.3% (41 of 1,760) had reached 10 cumulative clicks. This cohort is thin so treat these as rough. The click figure falls to 5.4% (35 of 651) with one large site excluded.
The 41 pages that reached 10 clicks within 180 days took a median of 104 days (p25 to p75: 51 to 135 days, n = 41).
What this means if you run your own site: reaching 10 clicks was slow even when it happened. Plan for months if you plan content around early traffic. Do not read a firm number into 41 pages.
Finding 6: established pages mostly stayed at zero clicks a month
Established pages mostly recorded no clicks in a typical month. The median was 0 clicks per page per month (p25 to p75: 0 to 0.083, n = 3,257 pages on 11 sites). The median across those 11 sites was also 0.
Only 11 sites qualify for this measure. It is the thinnest in the study. I would not lean on it.
What this means if you run your own site: a page that is a year old with no clicks in a typical month looks ordinary on my sites. Spend your first hour on pages that already have some clicks and some impressions. A small gain there is easiest to measure.
Finding 7: how the picture changes with site size
Sites with more pages did not show a lower zero-click share in this sample. I split sites by their number of pages with impressions in 12 months: under 50 pages (25 sites), 50 to 200 pages (26 sites) and over 200 pages (33 sites).
Zero-click share by site size
| Zero-click share by site size | Value |
|---|---|
| Under 50 pages (25 sites) | 86.7% |
| 50 to 200 pages (26 sites) | 82.6% |
| Over 200 pages (33 sites) | 94.8% |
Source: Author's own portfolio data, Google Search Console API
Scroll horizontally if columns extend beyond the screen.
| Measure | Under 50 pages | 50 to 200 pages | Over 200 pages |
|---|---|---|---|
| Sites | 25 | 26 | 33 |
| Median zero-click share (p25 to p75) | 86.7% (79.2% to 92.6%) | 82.6% (78.0% to 88.8%) | 94.8% (77.8% to 97.1%) |
| Median 12-month clicks per site (p25 to p75) | 3 (1 to 9) | 30 (15 to 85) | 119 (40 to 757) |
| Median top-10% click share (p25 to p75) | 95.1% (80.6% to 100%), n = 19 | 86.5% (75.8% to 96.8%), n = 24 | 100% (91.6% to 100%), n = 33 |
What this means if you run your own site: compare yourself with your own size band first. The under-50 sites had very few clicks in total. Their shares rest on small counts. The over-200 sites were the most concentrated of the three.
Finding 8: most low-volume top-3 queries got no click
Most low-volume queries that averaged a top-3 position got no click. 344 of 421 queries (81.7%) with 10 or more impressions and an average position of 3 or better recorded zero clicks from 30 October 2025 to 29 October 2026. They come from the 32 sites that had any such queries. The 421 queries drew 733 clicks from 24,704 impressions. That is a 3.0% click-through rate.
At an average position of 1.5 or better the share was 166 of 178 queries (93.3%). With a 50-impression threshold and position 3 or better it was 47 of 74 queries (63.5%).
Top-3 queries with zero clicks
| Top-3 queries with zero clicks | Value |
|---|---|
| 10+ impressions and position 3 or better (421 queries) | 81.7% |
| 10+ impressions and position 1.5 or better (178 queries) | 93.3% |
| 50+ impressions and position 3 or better (74 queries) | 63.5% |
Source: Author's own portfolio data, Google Search Console API, 30 Oct 2025 to 29 Oct 2026
Google hides anonymised long-tail queries so rare searches are missing from this count. Position is a 12-month average and can hide a query that moved in and out of the top 3. Only 32 of the 100 sites had qualifying queries and the counts are small. I do not report per-site medians because they rest on too few sites. The data cannot say why these queries got no click.
What this means if you run your own site: filter your own Queries report for 10 or more impressions and position 3 or better. Sort by clicks and look at the zero-click rows first. Search each one in Google and see what sits above your result. Then decide whether the title or the intent needs work.
How to compare your own site
You can compute both shares for your own site in a spreadsheet from a Search Console Pages export.
- Open Performance in Search Console, set the date range to the last 12 months and open the Pages tab.
- Export the table to Google Sheets or CSV. The Search Console Pages report exports up to 1,000 rows. Your shares will be approximate if your site has more pages with impressions than that.
- Put the page URLs in column A and the clicks in column B with the header in row 1. Search Console only lists pages that had impressions. That matches the denominator I used.
- Enter
=COUNTIF(B2:B,0)/COUNTA(A2:A)in an empty cell for the zero-click share and format it as a percentage. - Sort the data by column B from largest to smallest. Enter
=MAX(1,ROUNDUP(COUNT(B2:B)*0.1,0))in cell E1 to get the number of pages in your top 10%. - Enter
=SUM(INDEX(B2:B,1):INDEX(B2:B,E1))/SUM(B2:B)in another cell and format it as a percentage. ReplaceB2:Bwith an explicit range such asB2:B1001in Excel. - Compare your two results with the medians and ranges above using the size band that matches your count of pages with impressions. One site will sit somewhere inside the spread. A result away from the median is not a fault by itself.
A zero-click share far above the upper end of the range points to a pruning job. A top-10% share near 100% means your clicks depend on a few pages. My Google CTR study covers how to filter Search Console data when you want to go deeper than page level.
Method
The data comes from the Google Search Console API. I pulled data for 1 June 2025 to 29 October 2026. Finding 8 uses the query-level pull for 30 October 2025 to 29 October 2026 (223,218 query rows). "12 months" means 30 October 2025 to 29 October 2026. The sample is 100 websites I own that have Google Search Console data. It comes from 183 property rows. I left out clients, leads, family sites, duplicate properties, properties whose ownership I could not confirm and my own consultancy site. Its migration distorts the new-page proxy. I checked the included list for client domains and found none.
I have built over 300 websites over the years. Forty-four of them are active tests right now. This study covers every site I still own that has Search Console data. That includes dormant sites and brings the sample to 100.
A new page is any page whose first appearance in the data comes at least 60 days after its property's first data. That is a proxy because Search Console cannot tell me when a page was published. It gave 20,517 pages on 77 sites. The 90-day and 180-day measures use only the new pages old enough to be measured at those ages. Timings run from a page's first appearance in the data. The top 10% of pages is the page count multiplied by 0.1 and rounded up.
An independent second script with separate data pulls recomputed the five headline numbers and matched all five exactly. A second script also recomputed the Finding 8 counts and matched them. Both scripts use the same API. This checks my arithmetic. It cannot check Google's sampling.
My data files, their windows and their licences are listed in the research data catalogue.
Caveats
- Survivorship: dead, deindexed and sold sites are absent. Pages that never got an impression have no rows.
- Niche mix: the sample is mostly UK affiliate and programmatic sites. A few large sites dominate the pooled numbers. I show site medians alongside them.
- New-page proxy: 32 properties start in March 2026. That date reflects when I set up the property and not when the site launched. The new-page timings are rough.
- Established-page cohort: only 11 sites qualify for the established-page measure.
- Search Console limits: the API holds about 16 months of history, caps rows at 50,000 a day and revises recent days.
- Query data: Finding 8 covers only queries Google reports. Anonymised queries are withheld. Only 32 of 100 sites have a qualifying query. Position is a 12-month average.
- Scope: these are sites I own and not the web. I draw no conclusion about websites in general.
Next step
Next step
Find which pages to prune and which to protect
The technical SEO audit is £495 and gives the full list of pages to prune, merge or protect with fixes in priority order.
I can also look over your numbers in a free 20-minute diagnosis. Bring your Pages export.
How to cite
Sunny Patel, "Small-Site SEO Benchmarks: What Happens to New Pages on 100 Sites," sunnypatel.co.uk, 1 November 2026, Google Search Console API, 100 websites I own that have Google Search Console data, 1 June 2025 to 29 October 2026. https://sunnypatel.co.uk/blog/small-site-seo-benchmarks/
More sourced figures from this site are collected in the statistics hub.