Where the EV charging directory started
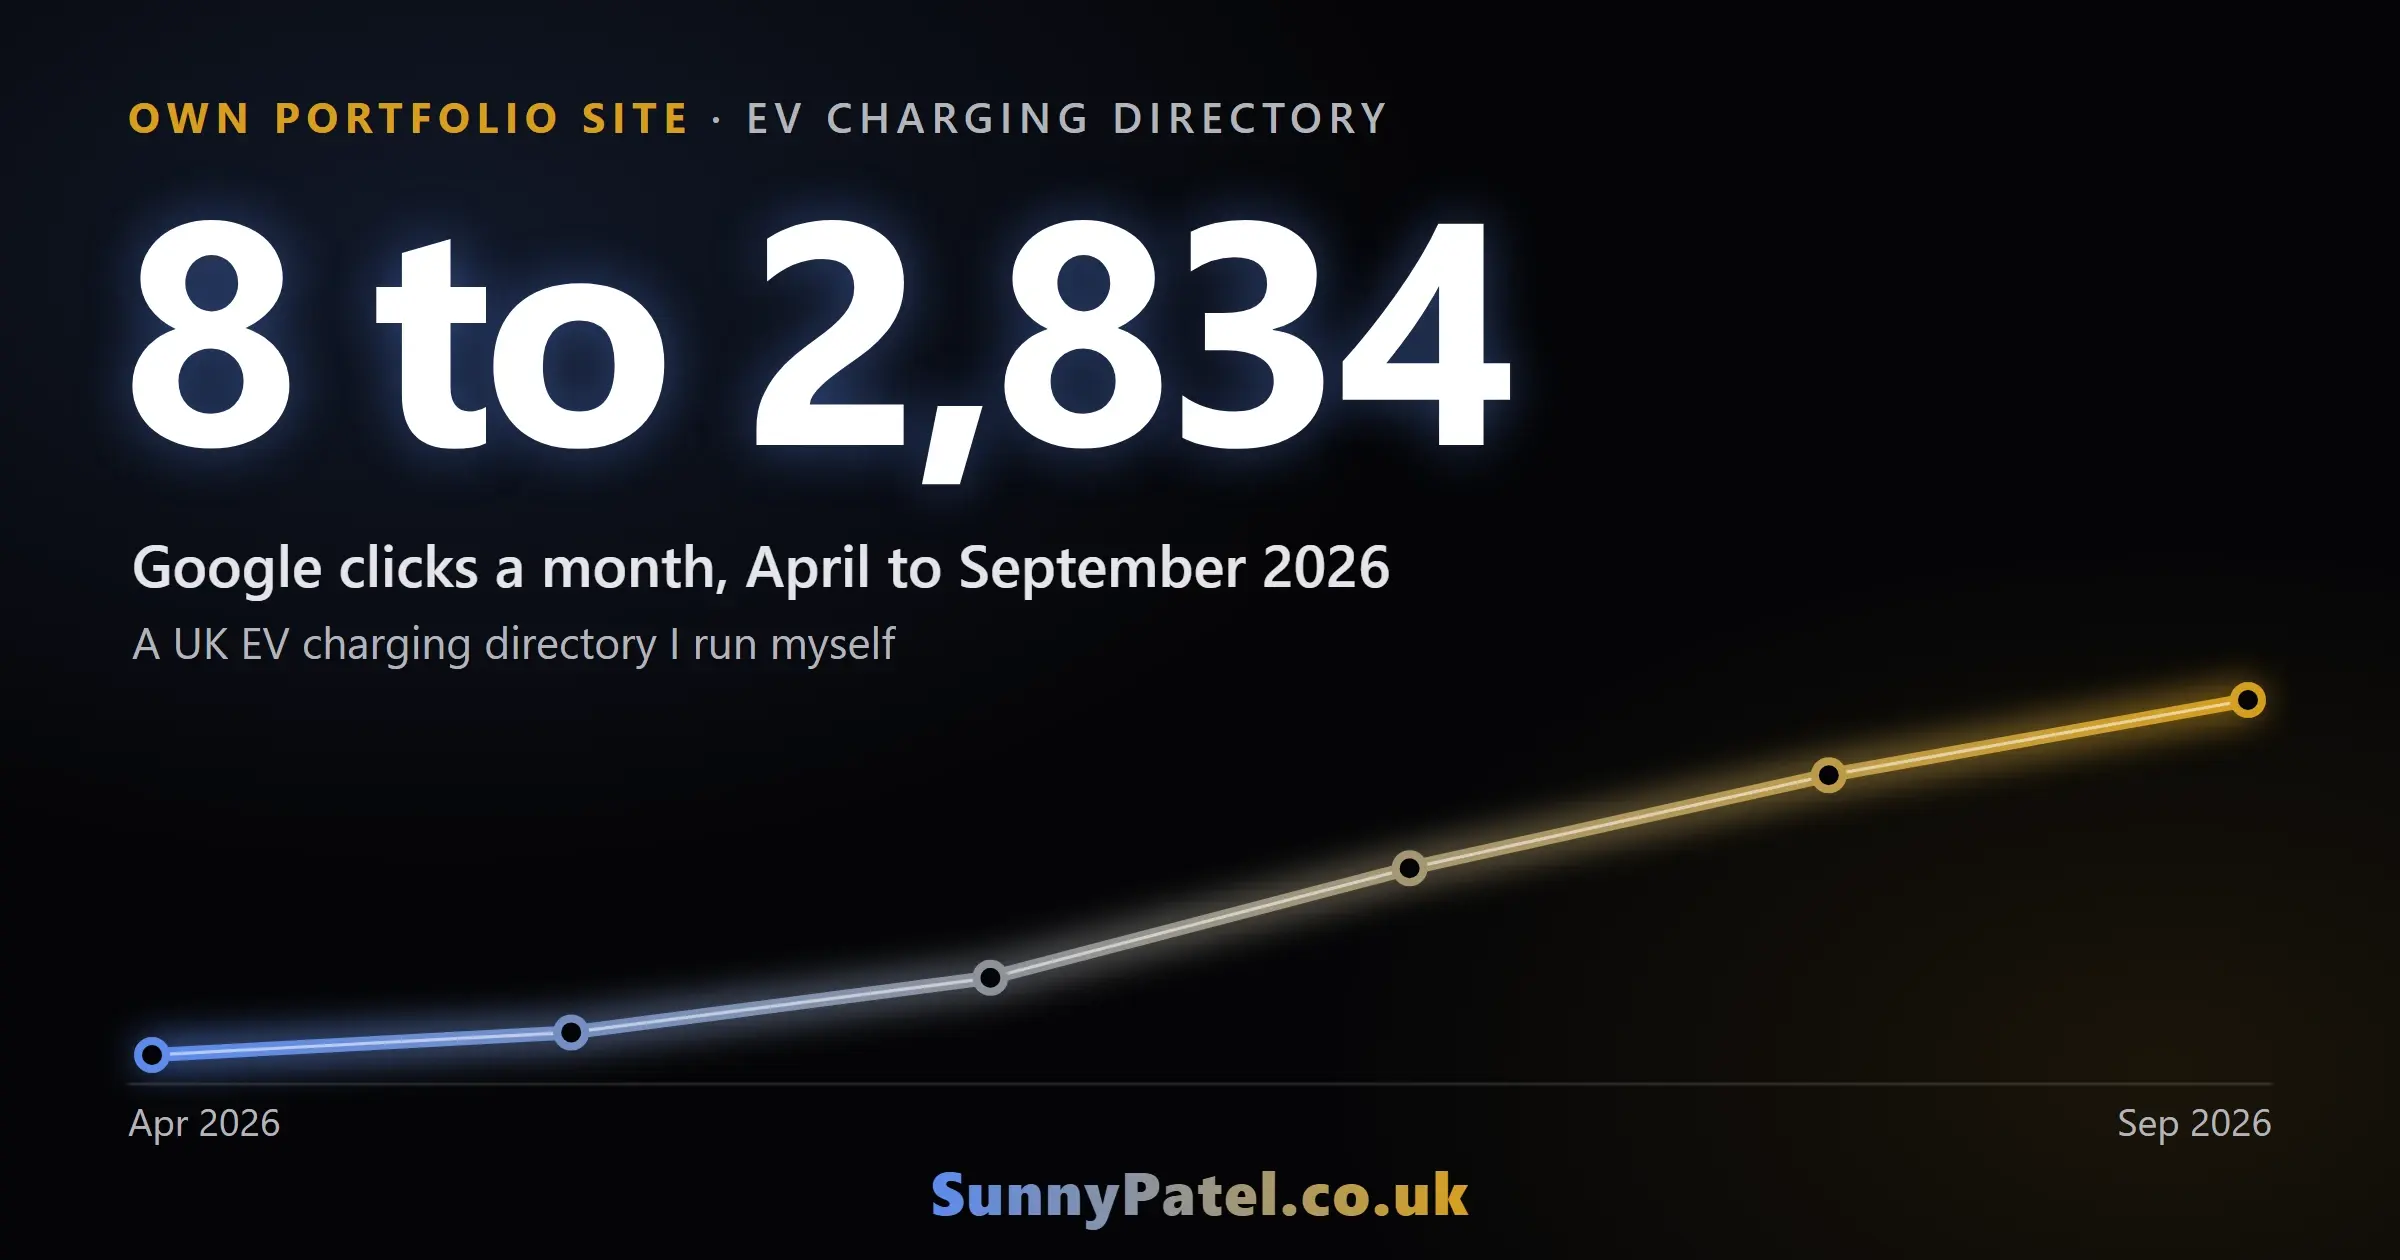
I'm Sunny Patel, and I own and run this UK EV charging directory. Google Search Console data, pulled on 4 October 2026, shows the directory earning 8 clicks from 864 impressions in April 2026, with daily impressions between 13 and 58. In September 2026 the same directory earned 2,834 clicks from 122,593 impressions. Monthly Google clicks therefore rose from 8 to 2,834 across the six calendar months from April to September 2026.
The growth came in a step, then a climb. Impressions for the EV charging directory moved from 62 on 14 May 2026 to 391 on 15 May and 1,001 on 16 May, and clicks moved from 0 on 14 May to 12 and 18 on the same two days. After that, monthly Google clicks rose every month: 188 in May, 622 in June, 1,495 in July, 2,236 in August and 2,834 in September.
Google clicks
| Google clicks | Value |
|---|---|
| Apr | 8 |
| May | 188 |
| Jun | 622 |
| Jul | 1,495 |
| Aug | 2,236 |
| Sep | 2,834 |
Source: Google Search Console via SEO Gets, 1 April to 30 September 2026, pulled 4 Oct 2026
Google impressions for the EV charging directory in April 2026
Google impressions for the EV charging directory in September 2026
These Search Console figures cover Google search only, from April to September 2026. April's 8 clicks are a very small baseline, so the growth looks large in proportion. The data does not establish what caused it.
What I built on the EV charging directory
The EV charging directory is a static Astro site of about 3,500 pages, hosted on Cloudflare. The counts in this section come from my project records of the June 2026 build, not from a fresh crawl. Those records list 3,293 postcode district pages, 121 town pages, 63 county pages, 12 charging network pages and a set of motorway pages. Hub pages group the location pages by county, area, network and motorway, and seven guides cover charging costs, free charging, rapid chargers, home chargers, road trips, charging apps and workplace charging. The recorded build was mainly location pages, supported by those seven guides.
On 14 June 2026 I deployed a redesign of the EV charging directory to its hosted deployment, with typeahead postcode search, filters on the location pages and three tools: a charging cost calculator, a charger comparison and a journey planner. My deployment record says the custom domain was still serving an older version that day and records the problem as resolved by 27 August 2026. I therefore do not treat 14 June as the date visitors first saw the redesign, and I do not use it as a dated traffic intervention.
I added installer quote forms to the location page templates in August 2026 to collect enquiries. I have not measured their effect on search traffic, and I have not verified a qualified enquiry from them.
The step in impressions on 15 May 2026 came before the redesign, the tools and the quote forms, so none of those changes explains it. I have not identified what did, and I have not separated which later changes moved Google clicks.
Some district charger counts and locations on the directory were procedurally generated. I cannot treat those fields as verified charge point information. Checking and replacing them against an open charge point dataset is still outstanding, and I would not recommend repeating this approach without that step.
Traffic from AI assistants to the EV charging directory
From 3 July to 1 October 2026, a 91-day window, GA4 attributed 737 sessions on the EV charging directory to the selected AI assistants. A session here is a recorded visit. ChatGPT accounted for 669 of those sessions, Copilot for 33, Gemini for 26, Perplexity for 8 and Claude for 1.
AI assistant sessions
| AI assistant sessions | Value |
|---|---|
| ChatGPT | 669 sessions |
| Copilot | 33 sessions |
| Gemini | 26 sessions |
| Perplexity | 8 sessions |
| Claude | 1 sessions |
Source: GA4, 3 July to 1 October 2026, pulled 4 Oct 2026
For scale, six organic search sources sent the EV charging directory 12,315 sessions in the same 91 days: Google 7,772, Bing 3,376, DuckDuckGo 798, Ecosia 337, Yahoo 23 and Qwant 9. That is a selected set of sources, not an exhaustive total of all organic search, so AI assistants sent about 6 sessions for every 100 sessions from those sources. I counted a session as coming from an assistant when GA4's source name matched ChatGPT, Copilot, Gemini, Perplexity or Claude. The Copilot figure includes 16 sessions whose medium GA4 left unset. The Gemini figure combines two source names, gemini and gemini.google.com, across three source and medium rows of 9, 9 and 8 sessions. One session from a Google Vertex search referrer is not counted as an assistant.
GA4 recorded these sessions with source labels matching the selected assistants. I have not independently verified the visitors or their click-through paths. The figures do not count citations, mentions or recommendations.
What the EV charging directory numbers do not show
- Search engines other than Google. The headline compares monthly Google Search Console clicks in April and September 2026. The separate GA4 comparison covers organic sessions from 3 July to 1 October 2026 and is not included in the Google click figures.
- Revenue and enquiries. This case study contains no revenue figure. I have not verified a qualified installer lead or any earnings from the EV charging directory, so it makes no income claim.
- AI citations. GA4 attributed 737 sessions on the EV charging directory to the selected assistant sources from 3 July to 1 October 2026, in the extract pulled on 4 October. This source-matching method cannot count citations, and it cannot reliably capture visits whose source attribution was lost.
- Data accuracy on the location pages. Some district charger counts and locations were procedurally generated, so I cannot treat those fields as verified charge point information. Checking and replacing them against a charge point dataset remains outstanding, and that gap is also a thin content risk for the growth shown here.
- Generality. This is one directory in one niche and one market, and the result started from near-zero traffic. Results vary by niche and starting point.
Questions about these results
Is the EV charging directory client work?
No. The EV charging directory is a site I own and operate in my own portfolio. I label it by sector. The traffic figures come from my Search Console and GA4 extracts, pulled on 4 October 2026. Build counts and implementation dates come from my project records.
Did AI assistants cite the EV charging directory?
This case study contains no citation test, so it cannot say whether assistants cited the EV charging directory. GA4 attributed 737 sessions to selected assistant sources from 3 July to 1 October 2026, but those records do not establish citation counts, recommendations or individual click-through paths, and they do not show which pages an assistant used.
Can another site expect the same growth?
Not on the strength of this one result. The EV charging directory grew from 8 clicks in April 2026 to 2,834 in September 2026 starting from almost no traffic, in one niche, with a very large set of location pages whose data is partly unverified. A site that already has traffic, or a site in a different market, would start from a different baseline and may behave differently.
What did I use to read these results?
For the EV charging directory, I used Search Console clicks and impressions for April to September 2026, GA4 sessions by source for 3 July to 1 October 2026, and a dated list of site changes from my project records. The two data sources cover different windows, which is why I do not combine them. Search traffic and assistant-attributed sessions are not enquiries, and I have not verified any enquiries here.
For a review of your search and referral traffic, start with a free 20-minute SEO diagnosis. My £1,500 AI Visibility Audit separately tests agreed buyer questions across available AI search modes and is delivered in two weeks. The six-site results page shows how assistant-attributed sessions compare across sectors.