
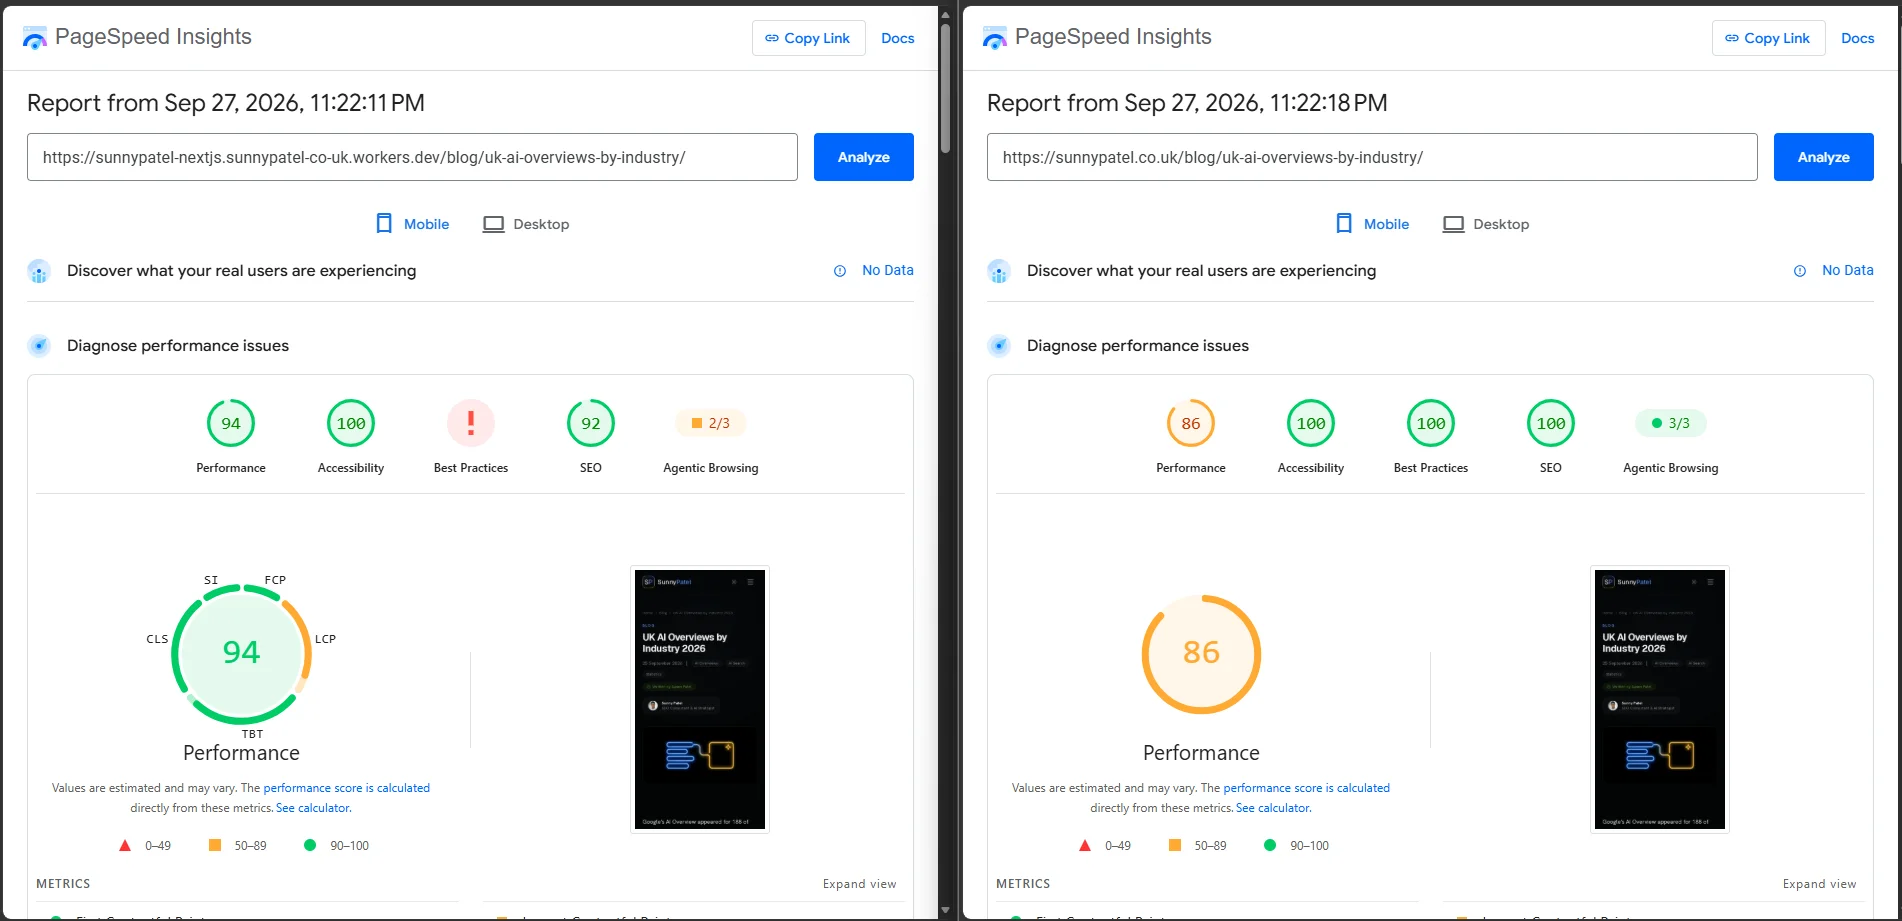
I initially called Vercel faster because its default Lighthouse scores led on all four mobile pages. That verdict was too strong. When I applied throttling in Chrome, the mobile performance medians for Vercel and Workers were 83/81 on the homepage, 85/85 on the blog page, 93/92 on services and 94/94 on the SSL checker. Both hosts scored 100 on every desktop page. These runs do not show a clear overall speed winner.
I deployed a Cloudflare Workers version of this Next.js site because its Vercel Hobby usage was approaching several limits. The live domain still routes to Vercel through Cloudflare. The migration exposed an adapter bug that made the first speed comparison misleading, so I fixed it before running the comparison below.
Why I tested the move
My Vercel dashboard showed 845,048 ISR reads out of a 1,000,000-read Hobby allowance over the preceding 30 days. This project accounted for 725,782 of those reads, or 85.9%. Fast Origin Transfer was at 6.62 GB out of 10 GB, edge requests were at 348,000 out of 1,000,000, and deployment storage was at 2.6 GB out of 10 GB. A Hobby limit can pause a project. Vercel Pro costs $20 per month.
I deployed the migration branch with OpenNext's Cloudflare adapter. Prerendered pages are served as Workers static assets, so requests to that deployment do not use Vercel's ISR allowance. The Worker currently runs on Cloudflare's free plan. The apex domain passes through Cloudflare before Vercel, so I excluded it from the fresh speed test.
How I measured Vercel and Cloudflare Workers
I compared the direct Vercel production host, sunnypatel-nextjs.vercel.app, with the migration branch on sunnypatel-nextjs.sunnypatel-co-uk.workers.dev. Both are platform subdomains. I checked for server: Vercel on the Vercel host before each batch.
The Vercel host served the current master build. The Worker served the migration branch, including the redirect move from proxy.ts, removal of optimizeCss, and the prefetch fix described below. This is a comparison of the two live deployments, not a controlled test of hosting alone.
On 28 September 2026, I ran Lighthouse 12 in headless Chrome from one UK connection. The first set used Lighthouse's default simulated throttling, with five runs per host, device and page. I then repeated all four pages with --throttling-method=devtools, which applies network and CPU throttling during the load. I alternated hosts, warmed each host and path with two unmeasured requests, and ran five additional mobile tests of the Worker blog page with QUIC disabled. The four paths were the homepage, an AI Overviews blog post, the services page and the SSL checker.
I also interleaved 30 curl requests per host and path to measure time to first byte. The PageSpeed Insights API returned HTTP 429 on all three attempts for each host, so I used the local Lighthouse reports. These are lab measurements. DevTools throttling is an applied browser throttle, though it still models network conditions at the request level. I have no CrUX field data for these platform subdomains, and a different connection or cache state can change the result.
Lighthouse results with simulated throttling
Mobile Lighthouse medians
Scroll horizontally if columns extend beyond the screen.
| Page | Performance V/W | LCP seconds V/W | Transfer KB V/W |
|---|---|---|---|
| Home | 87 / 82 | 2.87 / 4.13 | 706 / 730 |
| AI Overviews post | 93 / 84 | 2.98 / 4.04 | 708 / 739 |
| Services | 96 / 95 | 2.40 / 2.47 | 641 / 663 |
| SSL checker | 98 / 96 | 2.28 / 2.43 | 568 / 580 |
Desktop Lighthouse medians
Scroll horizontally if columns extend beyond the screen.
| Page | Performance V/W | LCP seconds V/W | Transfer KB V/W |
|---|---|---|---|
| Home | 100 / 99 | 0.58 / 0.84 | 712 / 739 |
| AI Overviews post | 100 / 99 | 0.57 / 0.86 | 710 / 741 |
| Services | 100 / 99 | 0.54 / 0.88 | 722 / 762 |
| SSL checker | 100 / 100 | 0.46 / 0.65 | 622 / 645 |
V/W means Vercel / Workers. These default Lighthouse scores favoured Vercel on all four mobile pages. On desktop, Vercel scored 100 on every page; Workers scored 99 on three and 100 on the SSL checker. Accessibility medians were 100 except on services, where both scored 96. Best Practices and SEO medians were 100 throughout. One Workers desktop blog run scored SEO 92, explained below.
Each figure is the median of five runs. Lighthouse calculated the paint timings in these tables with its Lantern simulation. The raw reports retain the actual browser observations from the same runs, as well as FCP, TBT, CLS, Speed Index, server response time, full score ranges and total transfer.
What changed when I applied throttling in Chrome
The new five-run medians were much closer. The table uses the same pages and hosts, with network and CPU throttling applied during each Chrome load.
Scroll horizontally if columns extend beyond the screen.
| Page | Mobile score V/W | Mobile LCP seconds V/W | Desktop score V/W | Desktop LCP seconds V/W |
|---|---|---|---|---|
| Home | 83 / 81 | 2.28 / 2.27 | 100 / 100 | 0.27 / 0.31 |
| AI Overviews post | 85 / 85 | 2.26 / 2.36 | 100 / 100 | 0.23 / 0.27 |
| Services | 93 / 92 | 1.98 / 1.97 | 100 / 100 | 0.22 / 0.21 |
| SSL checker | 94 / 94 | 2.03 / 2.08 | 100 / 100 | 0.22 / 0.21 |
I also checked the observed FCP and LCP values in the earlier, unthrottled browser traces. They differ from Lantern's simulated timings. Each cell below is median FCP / LCP in milliseconds across five runs.
Scroll horizontally if columns extend beyond the screen.
| Device | Page | Observed Vercel FCP / LCP | Observed Workers FCP / LCP |
|---|---|---|---|
| Mobile | Home | 496 / 496 | 1267 / 1267 |
| Mobile | AI Overviews post | 1326 / 1326 | 1266 / 1283 |
| Mobile | Services | 1290 / 1290 | 1315 / 1315 |
| Mobile | SSL checker | 1336 / 1336 | 260 / 260 |
| Desktop | Home | 398 / 398 | 385 / 385 |
| Desktop | AI Overviews post | 398 / 398 | 388 / 388 |
| Desktop | Services | 356 / 356 | 368 / 368 |
| Desktop | SSL checker | 273 / 273 | 277 / 277 |
The observed mobile home and SSL checker timings pull in opposite directions. The other pages and the desktop observations are close. The default simulated scores therefore gave me more confidence in a Vercel speed lead than the browser observations warranted.
Lighthouse's throttling guide explains that its default method models a slower load from an unthrottled trace. DevTools throttling applies a request-level network limit and slows CPU work in Chrome. Neither method is a field measurement or a packet-level mobile network test.
The protocol mix may matter to the simulation. Across the five mobile blog runs, Vercel made 225 first-party requests over h2. Workers made 283 over h3 and 12 over h2. I disabled QUIC for five more Worker blog runs: all 295 first-party requests used h2, the median score was 86 and LCP was 2.31 seconds. With h3, Workers scored 85 with 2.36 seconds LCP; Vercel scored 85 with 2.26 seconds LCP. The h2 control stayed close. Different handling of QUIC latency by Lantern is one possible reason for the earlier simulated gap, but this test does not isolate that cause.
Time to first byte and response delivery
Scroll horizontally if columns extend beyond the screen.
| Page | TTFB median ms V/W | p90 ms V/W | HTML bytes V/W |
|---|---|---|---|
| Home | 118 / 163 | 168 / 331 | 314670 / 312905 |
| AI Overviews post | 99 / 121 | 170 / 154 | 257227 / 256002 |
| Services | 115 / 127 | 154 / 173 | 449137 / 448402 |
| SSL checker | 115 / 115 | 170 / 186 | 111032 / 110347 |
V/W means Vercel / Workers. TTFB is curl's time_starttransfer, including DNS, connection setup and server work. The requests were interleaved between hosts. Vercel had the lower median on three pages; the SSL checker was effectively tied. The HTML byte figures are curl's downloaded document bytes, while the Lighthouse transfer figures above include page assets.
This Windows curl supports HTTP/1.1, so I used the Lighthouse browser records to check protocol. All 40 Vercel document loads used h2. The Worker used h3 on 31 and h2 on nine, and advertised h3 through alt-svc. Vercel returned x-vercel-cache: HIT on every curl request, with an age header. The Worker returned s-maxage=31536000 and stale-while-revalidate=2592000, without cf-cache-status or age in these responses. The headers describe the platform subdomains, not the proxied apex.
The prefetch bug behind the first comparison
My first Workers homepage Lighthouse runs were affected by thousands of repeated _rsc requests. One uncapped run logged 6,475 requests and 52.5 MB of transfer; another logged 7,435 requests and 60.5 MB. A five-run mobile homepage batch taken before the fix had a Workers performance median of 86 against 93 on the then-direct Vercel apex. Those numbers belong to the faulty deployment and should not be read as a clean platform comparison.
The cause was specific to this Next.js and OpenNext combination. Next.js 16.3 enabled experimental.prefetchInlining by default. OpenNext's cache interceptor saw that setting and sent full-page React Server Component data when the browser asked for a small route-tree segment. The browser could not use that response and kept requesting it. A /blog/ segment request returned 246,766 bytes on the faulty Worker, against 642 bytes on Vercel.
I set experimental: { prefetchInlining: false } in next.config.ts. The fixed Worker returns a 602-byte segment with x-nextjs-postponed: 2. In a 15-second headless browser check, _rsc requests fell from 2,480 to 21 on the Workers homepage and from 2,840 to 30 on /blog/. The direct Vercel host made 11 requests on each page. The fixed Worker counts are in the same range, with no runaway loop.
The request storm also explains one oddity in my original PageSpeed Insights screenshot. Workers Best Practices showed an error. A reproduced Lighthouse audit failed its charset check because Chrome DevTools had evicted the main document body from its inspector cache during the storm. That was a test failure on the faulty deployment, not evidence of an inherent Cloudflare penalty.
The screenshot's Workers SEO score was 92. One fresh Workers desktop blog run also scored 92: its robots-txt audit failed because Lighthouse could not download the file. The other four Workers desktop runs scored 100, and the robots file responded when I checked it directly. A transient audit fetch could explain the screenshot, but I do not have its original PSI JSON to confirm that it failed the same audit. The workers.dev canonical audit passed in the fresh run.
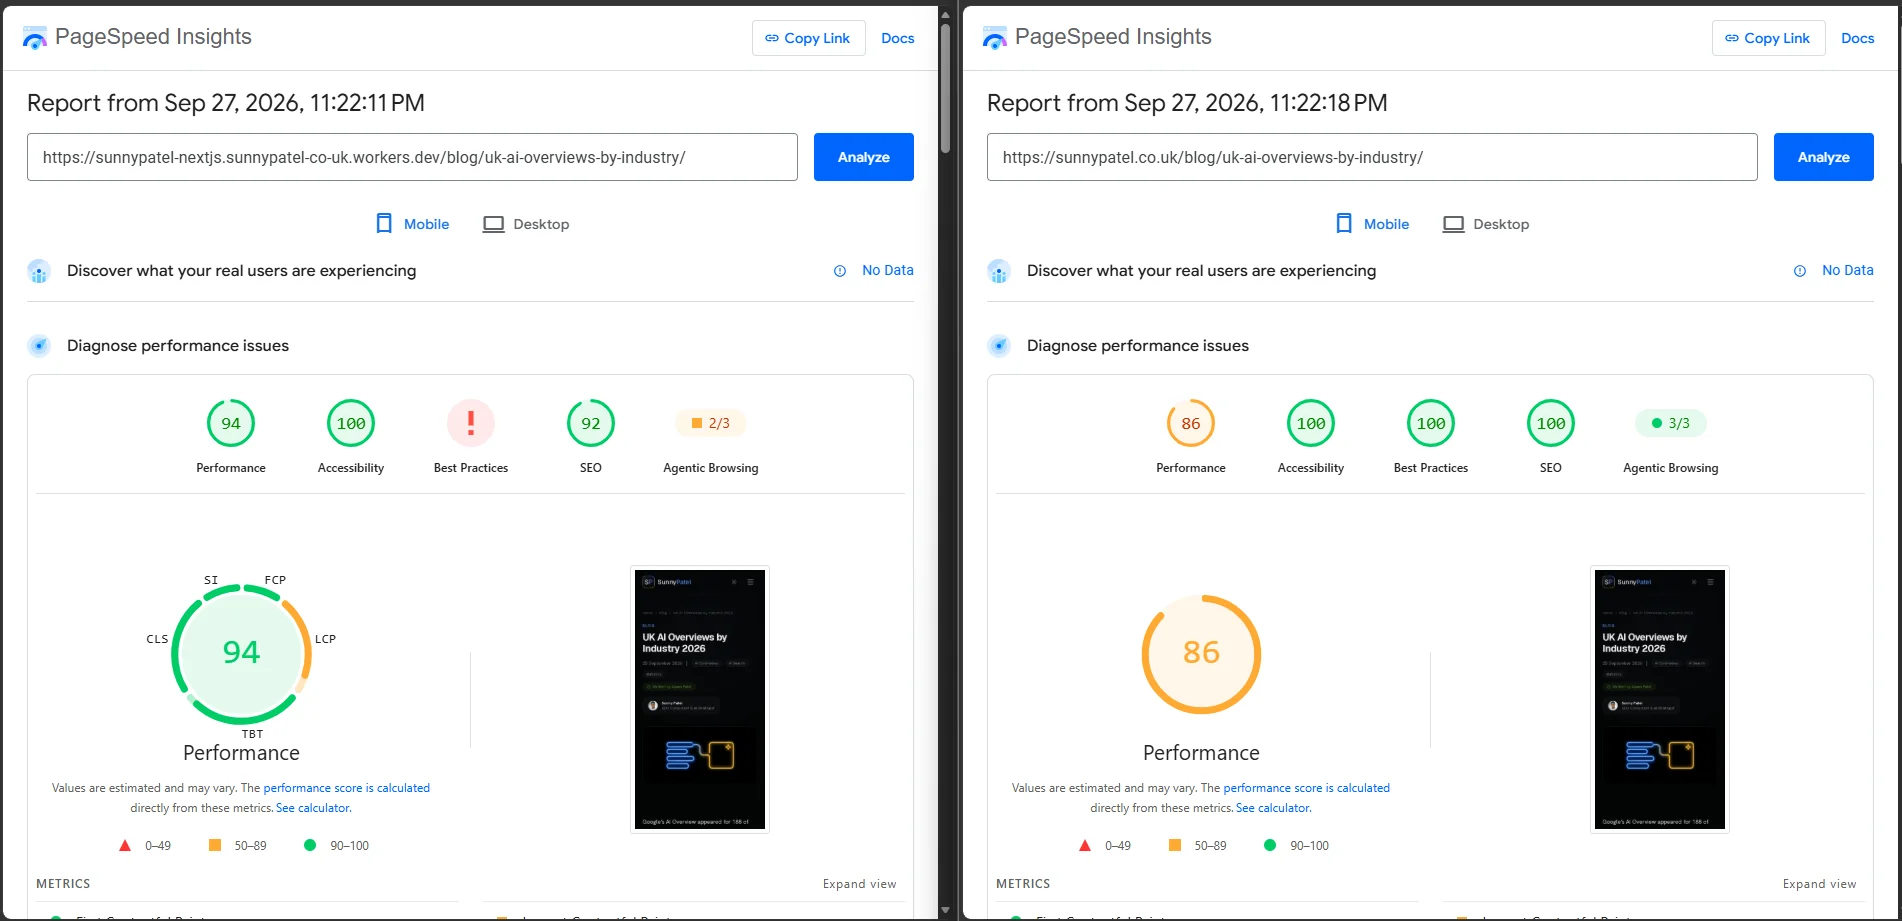
That screenshot is a single pre-fix run from 27 September. The apex later moved behind Cloudflare and is not the Vercel host in my fresh measurements.
What broke during the migration
The adapter converted the Next.js build into a Worker, but several features needed changes in this project:
- Next.js 16's
proxy.tsredirects did not work in this deployment. I moved two redirects intoworker.ts. experimental.optimizeCssbroke the OpenNext build. I removed it; this App Router site's CSS delivery did not change.- A
next.configrewrite for the static CV PDF returned a 404 on Workers. I moved the route intoworker.ts. - The SSL checker used
node:tlsfor the peer certificate. Workers could not provide that raw TLS access. It now uses a live HTTPS handshake and the Cert Spotter certificate transparency API. I removed the serial-number and signature-algorithm display. - The Worker bundle initially compressed to 3.33 MB, above the 3 MB deployment threshold encountered during the move. The runtime OG renderer was unnecessary because the OG images were prerendered. Stubbing that renderer brought the bundle to 2.73 MB. A build guard stops any OG route that would need runtime rendering. Cloudflare's current limits page no longer lists a compressed-size cap, so this records the threshold I encountered during the move.
On workers.dev, 200 of 200 sitemap URLs returned 200, all 188 checked OG images loaded, and the redirects matched. DNS nameservers moved to Cloudflare while Hostinger Mail kept its MX, SPF and DKIM records. The apex still reaches Vercel. Those checks cannot cover every future Next.js feature.
Cost and who should move
The Worker deployment currently costs me £0 on Cloudflare's free plan. The comparison with Vercel Pro is $20 per month before any other usage charges. My reason to test the move was the site's approach to Hobby limits, especially ISR reads. Live traffic still reaches Vercel, so this is not a realised hosting saving.
The free-plan outcome depends on this site's request volume, bundle and feature use; it is not a universal price quote. Vercel's pricing can change, so check the current terms for your own deployment.
A mostly prerendered Next.js site like this one can benefit if Vercel's usage limits are the constraint and you can test the Worker build properly. Keep a Vercel deployment if you rely on its managed Next.js behaviour and do not want to adapt middleware, rewrites, Node APIs or runtime image generation. For a Worker move, check those features against your own routes before moving traffic.
My verdict
I no longer have evidence to call Vercel faster overall. Its default simulated Lighthouse scores led on mobile and its curl TTFB was lower on three pages, while the observed browser timings and the new applied-throttling medians were close or mixed. The Worker build offers a route away from Vercel's ISR allowance, and its prefetch request storm is fixed. The builds and hostnames differ, so these measurements cannot isolate a pure hosting effect. I would decide on a traffic move after testing the route changes and performance against the live domain.