SEO Statistics UK

Last updated: 11 September 2026. Rewritten on 26 August 2026 after the previous version stopped getting indexed by Google, most likely because it repeated the same aggregated global stats every other "SEO statistics" roundup uses. This version leads with real UK data, my own published research, and an honest explanation of why the industry's most-quoted numbers disagree with each other.

Key SEO Statistics for 2026 (Quick Reference)

  • Position 1 on Google earned 5.96% CTR across 53 UK sites I manage, not the 25-30% still quoted in most decks (own data, 2026)
  • The UK SEO and internet marketing consultancy industry generated £24.6 billion in revenue in 2025-26, growing at 6.6% a year (IBISWorld)
  • Google holds 91-92% of UK search share; Bing sits around 5.9-6.2% overall but climbs to nearly 13% on desktop (Statcounter, 2026)
  • SEO leads close at 14.6%, against 1.7% for outbound; the average organic lead costs $31 versus $181 for PPC (First Page Sage)
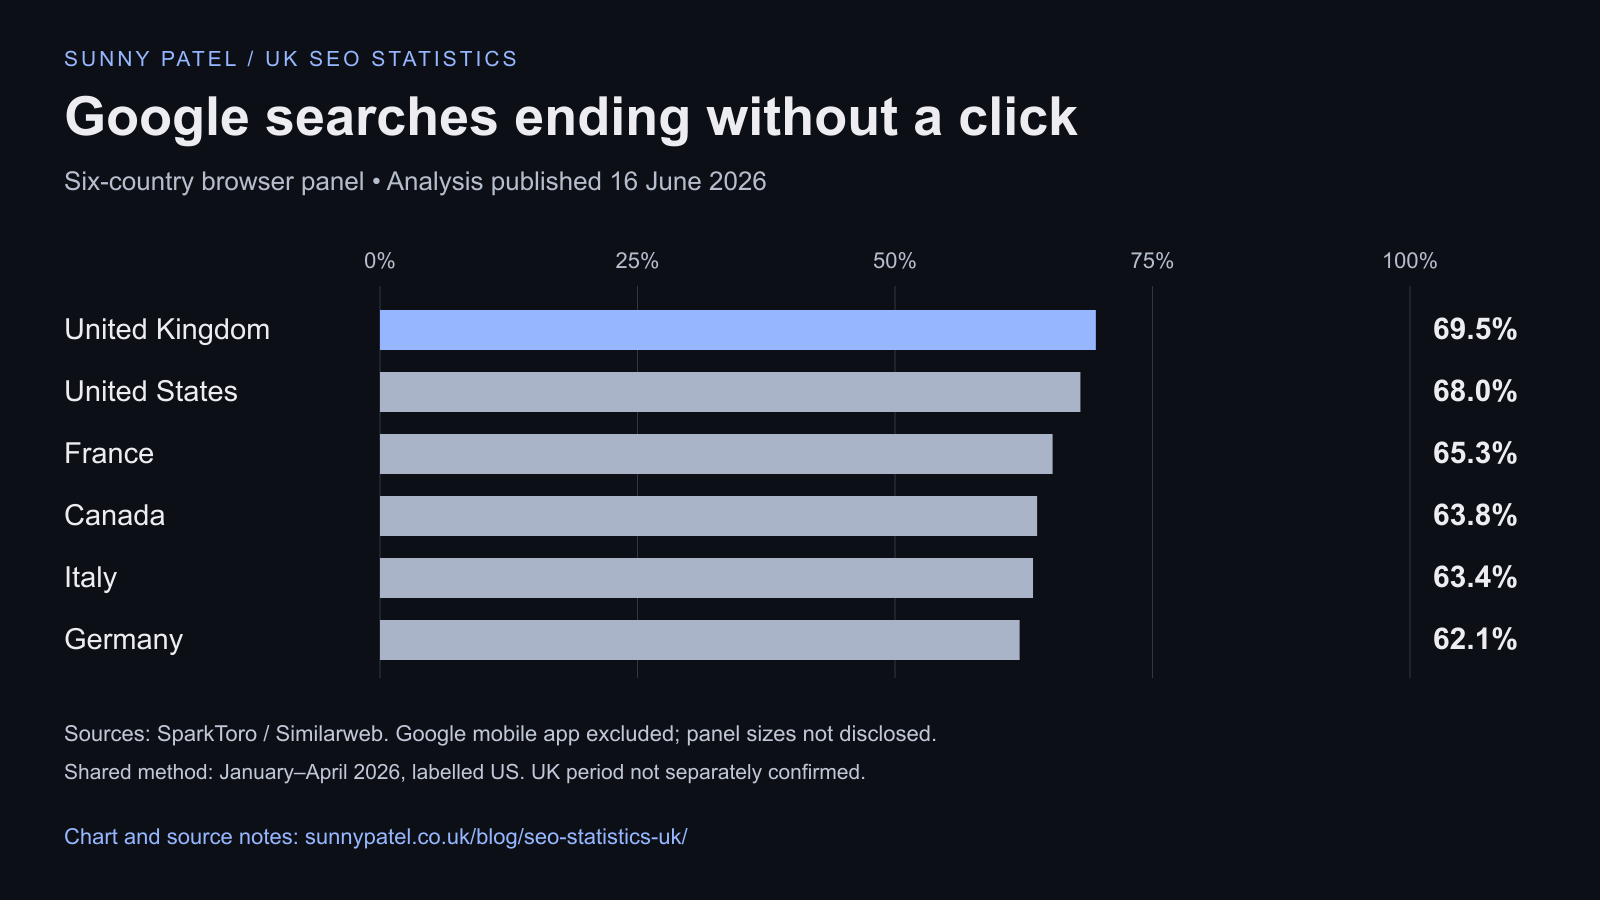
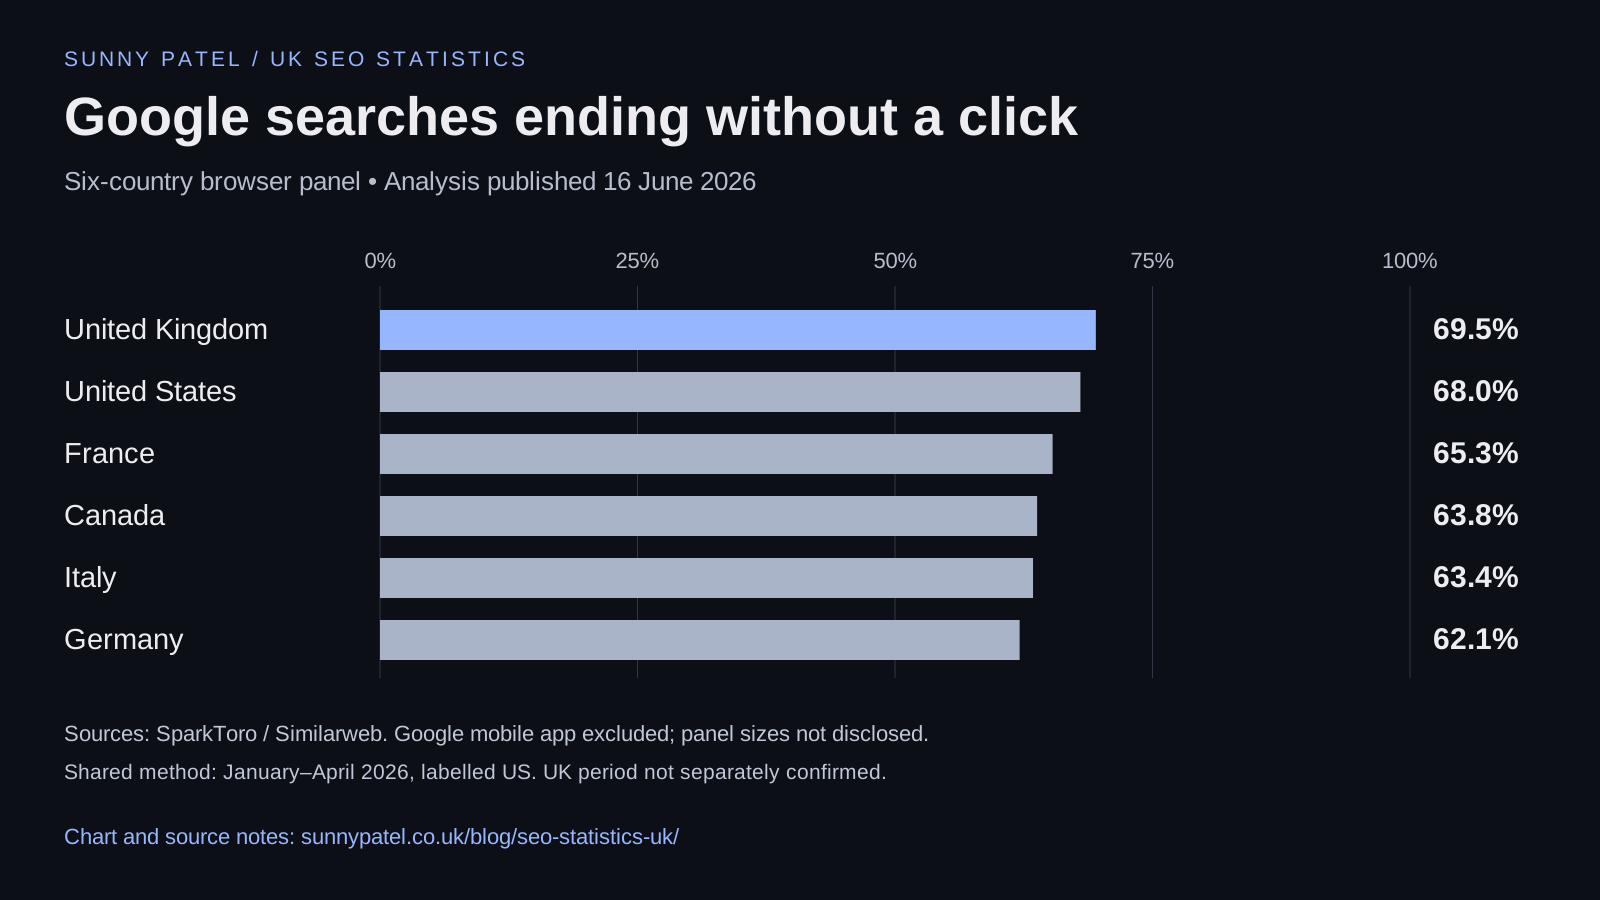
  • 68.01% of Google searches in the US ended without a click in the first four months of 2026, up from 60.45% in 2024 (SparkToro)
  • Google AI Overviews now appear on anywhere from roughly 25% to 48% of tracked queries depending on whose study you read, and the range itself is the finding (Conductor, BrightEdge, 2026)
  • Only 48-49% of mobile sites pass Core Web Vitals, up from 32% in 2021 (HTTP Archive)
  • ChatGPT sent 91% of AI referral traffic across 12 of my own sites over 90 days; Gemini sent 3 sessions total (own data, August 2026)

Want these benchmarks checked against your own site? Book a fixed-fee technical SEO audit and get a data-backed plan, or run the free website grader for an instant read on where you stand.


Most "SEO statistics" pages, including the previous version of this one, are the same 15 numbers copied from Backlinko and First Page Sage into a new template every January. That's why this page needed a proper rewrite rather than a date change: Google stopped indexing the old version, and the most likely reason is that it added nothing a dozen other pages didn't already say, better, and with fresher numbers.

This version does three things differently. First, it leads with real data from my own portfolio, not only aggregated third-party studies, because I run 53 UK sites' worth of Search Console data and I can show you what actually happened rather than what a vendor's dataset implies happened. Second, it's honest about where the well-known industry figures contradict each other and why, so you can pick the right number for your situation instead of quoting whichever one reads most impressively in a pitch deck. Third, it's UK-specific where UK data actually exists, rather than relabelling US stats with a Union Jack.

Why Published SEO Stats Disagree With Each Other

If you've ever benchmarked your own Google Search Console numbers against a "position 1 gets 27% CTR" stat and wondered why your site gets nothing close to that, you're not doing anything wrong. The stat is measuring a different internet to the one your site sits in.

I ran the numbers myself. Across 53 UK sites and 2,615 query rows over 90 days, position 1 earned 5.96% CTR, not 27.6%. Position 4 beat it outright at 8.61%. Position 2 earned only 0.22%, worse than position 10. None of that matches the smooth descending curve every SEO deck still uses.

Both curves are real, they measure different things. Backlinko and Semrush's widely cited historical figures aggregate millions of queries across sites of every size, an aggregate dominated by brand searches: someone typing "asos" or "hmrc login" already chose the destination before they searched, so position 1 gets clicked at huge rates. First Page Sage's 2026 meta-analysis puts position 1 at 39.8%, even higher, again built from a mixed sample that includes branded and navigational queries. My dataset is 53 small UK sites ranking almost entirely for non-brand, long-tail queries, comparisons, questions, product research. Nobody typed those queries looking for one of my sites specifically. Strip brand traffic out and the industry-standard curve disappears.

The same pattern shows up with AI Overviews. Ask how often they appear on Google and you'll get answers from roughly 25% to 48% depending on the study (Conductor's 21.9-million-query analysis says roughly 25%, BrightEdge says 48% as of February 2026, up from around 31% a year earlier), because "AI Overviews appear on X% of searches" depends entirely on which queries the researcher sampled. Healthcare queries trigger them on close to 49% of searches in Conductor's data; real estate queries trigger them on under 5%. If your niche is closer to local trades than to symptom-checking, the 48% headline overstates your reality by a wide margin, and even the 25% figure probably still overstates it. Ask about the CTR impact and you get more disagreement still: First Page Sage's meta-analysis says AI Overviews have "minimal impact" on organic CTR, while Seer Interactive's ongoing monthly tracking puts organic CTR, averaged across all ranking positions rather than position 1 alone, at roughly 0.6% on AI-Overview queries against up to 3.8% on queries without one across its 2025-26 snapshots, a drop of well over half in most months it has measured.

None of this means the published stats are wrong. It means a single number can't describe a market this fragmented. When you're building a business case or checking your own performance, the questions worth asking are: what query mix does this stat's sample use, does it match mine, and does the study say so. If it doesn't disclose its sample, treat the number as a rough steer, not a target.

What This Looks Like When You're Building a Business Case

If you're the one having to justify SEO spend to a boss or a client, the number that actually moves a budget conversation is what SEO costs against what it returns compared with the alternative channel you'd spend the money on instead, not "position 1 gets 27% CTR".

First Page Sage's 2026 data puts the average organic lead at $31 against $181 for a PPC lead, a 5.8x cost difference, with SEO leads closing at 14.6% against 1.7% for outbound. Its separate SEO-versus-PPC comparison puts SEO at 748% ROI against PPC's 36% over the same period, though the gap only opens up after the campaign has had time to compound; PPC's return is roughly flat month to month, while SEO's climbs. I've dropped the flat "825% average ROI across all industries" figure the old version of this page used, because First Page Sage's current published report doesn't state a single blended average, only a per-industry range from 317% (ecommerce) to 1,389% (real estate). Repeating a number I can no longer verify at the source isn't something I'm going to do, and if you've seen that 825% figure elsewhere recently, it's worth asking where it's sourced from.

IndustrySEO ROI (3yr)
Real Estate1,389%
Medical Device1,183%
PCB Design & Manufacturing1,101%
Financial Services1,031%
Higher Education994%
Oil & Gas906%
Industrial IoT866%
Pharmaceutical826%
Manufacturing813%
B2B SaaS702%
eCommerce317%

(Source: First Page Sage, 2026 industry ROI report)

If you're pricing this internally, forecast it yourself rather than quoting an industry average that has nothing to do with your keywords. My SEO ROI calculator walks through the same five inputs I use, and how to calculate SEO ROI shows the worked example in pounds. If you're pricing external help rather than doing it in-house, what an SEO consultant actually charges in the UK covers current hourly and retainer rates.

UK SEO Market Size and Search Behaviour

This is the section most "SEO statistics UK" pages skip, because it's genuinely UK-specific data rather than US research with a UK label stuck on top.

The UK SEO and internet marketing consultancy industry generated £24.6 billion in revenue in 2025-26, growing at a 6.6% compound annual rate over five years (IBISWorld). There are 35,088 UK businesses operating in this space, up 6.2% a year since 2021, averaging roughly £700,000 in revenue each. UK search advertising spend reached £16.9 billion in 2024, about £4 in every £10 of total UK ad spend, which tells you how much budget is chasing the paid alternative to the organic strategy this page is about.

Google holds 91-92% of UK search share overall (Statcounter, April 2026). Bing sits at roughly 5.9-6.2% blended, but that hides a real device split: Bing climbs to nearly 13% on UK desktop against a much smaller mobile share, a gap wider than any other major search engine shows in the UK market. If a meaningful share of your audience searches from a work desktop, Bing Webmaster Tools is worth checking even if your Google Search Console numbers dominate the conversation.

AI adoption in the UK is moving fast from a low base. UK visits to ChatGPT ran at roughly 250 million a month in the second half of 2025, with the UK sitting among ChatGPT's top handful of markets globally at around 3-4% of its total traffic (Similarweb). UK-specific AI Overview appearance-rate tracking is thinner and less consistent than the large US studies quoted above, and the figures that do exist disagree sharply: some trackers put UK mobile appearance well below the roughly 48% global rate BrightEdge measured. That is the same lesson as above in miniature: treat any single AI Overview appearance rate as a range rather than a fixed number until you've checked it against your own query set.

Click-Through Rate: My Data vs the Industry Curve

The position-by-position numbers behind the claims above come from 53 UK sites and 2,615 non-brand query rows, set here against the widely quoted industry meta-analysis for a direct comparison. Full methodology is in my CTR by position study.

PositionMy data (53 UK sites, non-brand queries)Impressions in my dataFirst Page Sage 2026 meta-analysis
15.96%72139.8%
20.22%3,19918.7%
31.58%2,78410.2%
48.61%4,3817.2%
52.96%5,0695.1%
61.59%25,649not published separately
71.02%25,582not published separately
80.27%14,787not published separately
90.75%9,783not published separately
100.53%8,5141.6%

Two findings from my own dataset matter more than the position-by-position table. First, 74% of all impressions in the study sat at position 11 or worse and returned a combined 0.08% CTR, while page 1 held only 26% of impressions but produced 87% of all clicks. Visibility on Google is a cliff at the bottom of page 1, not a gradient. Second, position 4 queries in this data earned roughly 31.89 times the CTR of position 8 queries (8.61% against 0.27%), a bigger gap than any title rewrite or schema addition could produce on its own. That is a cross-sectional comparison of two different position buckets' average CTR across the full query set, not a single query tracked moving from one position to the other over time. If you're deciding where to spend limited SEO hours, queries already sitting at positions 6-10 with real impressions are usually the higher-leverage move over CTR copywriting on page one queries that already convert.

The middle of the table is where most published CTR studies go quiet, because First Page Sage's meta-analysis only reports positions 1, 2, 3, 4, 5 and 10 explicitly. My own dataset has no such gap: positions 6 to 10 carried 84,315 impressions between them, 22% of the study's total volume, at a blended CTR of roughly 1%. That is real, high-volume demand sitting just below the fold, and it is the single most useful segment in the whole dataset for deciding where to spend SEO hours, because a query already ranking at position 6 to 10 needs a ranking push, not a title rewrite, to convert that visibility into clicks. Position 6 alone produced more clicks (407) than positions 1, 2 and 3 combined (94), on the strength of impression volume rather than a high rate. Position 2's 0.22% CTR, not position 8's, is actually the low point of the entire top-10 range, a reminder that a position bucket's rate can be dragged down by one or two high-impression, zero-intent queries rather than reflecting a genuine ceiling on what that position can earn.

Methodology, in brief: every figure above comes from Google Search Console query-level data across the same 53 UK-managed sites, filtered to query rows with at least 50 impressions over 90 days to 7 July 2026, then bucketed by each row's rounded average position for the period (2,615 query rows in total). The sample thins fast above position 5: just 5 query rows sat at position 1 and 6 at position 2, so treat the exact top-of-curve percentages as indicative rather than a universal constant, a caveat I hold to as much for my own data as I ask you to hold published industry curves to. The full bucketed table through positions 21+, the per-bucket query-row counts, and an open licence to reuse the figures with attribution are all in the source study linked above.

If your own CTR doesn't match either table here, that's normal. Filter your Search Console data to non-brand queries only and compare against my numbers instead of the industry average; the intent mix, not the position, is usually what's driving the gap.

AI Search: What's Actually Sending Traffic

This section skips the full AI Overviews stat block; a dedicated page already covers that in depth, and repeating it here would only duplicate rather than add anything. What follows instead is measured referral traffic numbers from my own sites.

Across 12 of my most-cited sites over 90 days to 1 August 2026, AI assistants sent 5,240 referral sessions total. ChatGPT accounted for 91% of them (4,780 sessions). Microsoft Copilot was a distant second at 4%, Perplexity at 3%, Claude at 2%, and Gemini sent 3 sessions across the entire 90-day dataset, effectively nothing. The sites that won this traffic weren't the commercial or review-led ones, they were condition-led, factual, structured content: a health and wellness site pulled 1,604 sessions on its own, an education data site pulled 1,233.

That referral count is a floor, not a ceiling. Most AI answers resolve the query without sending a click at all, which is the same zero-click pattern showing up in Google: 68.01% of US Google searches ended without a click in the first four months of 2026, against 60.45% in 2024, the steepest two-year rise SparkToro has recorded. Searches that trigger an AI Overview show an average zero-click rate of 83%. Being the source an AI system cites, whether or not that produces a click, is doing more for a brand's visibility now than an extra position or two in the blue links. The full breakdown of appearance rates, citation overlap with Google's top 10, and what to actually build for AI visibility is in the AI search statistics page.

Content, Technical SEO, and Local: The Short Version

These three areas each have a dedicated, fuller breakdown on this site; here's the headline number from each so this page still answers the question on its own, with a link through for the detail.

Content. Average blog post length now sits at 1,312 words (Orbit Media's 2026 Annual Blogging Survey, 1,042 respondents), and only 13.9% of bloggers report "strong results," an all-time survey low, down from 26% in 2022. Bloggers combining six or more tactics are roughly 3x more likely to land in that group. Full breakdown: content marketing statistics.

Technical. 48-49% of mobile sites pass Google's Core Web Vitals as of 2026 (HTTP Archive), up from 32% in 2021 and 36% in 2023, gradual progress that's slowing as the easy fixes get exhausted. A one-second delay in mobile load time can still cost up to 20% of conversions, with desktop's hit smaller at around 7% (Google), and mobile now drives around 63-65% of Google searches and a majority of overall web traffic. A technical SEO audit finds exactly where a given site sits against these numbers.

Local. 46% of Google searches carry local intent (a widely cited figure that is not UK-specific), and 76% of people who search for something nearby on their phone visit a related business within a day; 28% of those searches, not the visits, result in a purchase (Think with Google). The Google Local Pack captures roughly 42% of clicks on local search results pages (Backlinko, 2026); separately, position 1 alone achieves a 17.8% click-through rate (BrightLocal, 2026), a different measurement from the 42% share rather than part of it. Full breakdown: local SEO statistics.

What These Statistics Mean For Your Business

Strip out the noise and three decisions fall out of this data.

Stop benchmarking against the industry curve if your traffic is non-brand. The 25-40% position-1 CTR figures quoted everywhere are built from samples dominated by brand searches. If most of your queries are non-brand, long-tail, or comparison-driven, my 53-site dataset predicts your reality far better than a headline built from a different market. Judge your own site against your own Search Console data, segmented by query type, not against a number from a study you've never read the methodology of.

Positions 6-10 are usually the better place to spend effort than the top 3. In my data, position 4 queries carry roughly 31.89 times the CTR of position 8 queries (8.61% against 0.27%), a cross-sectional gap between two position buckets, not a single query tracked moving between them. That's a bigger lever than most on-page or CTR copywriting work can pull on its own, and it's often cheaper to execute than trying to unseat an entrenched position 1-3.

AI visibility is now a parallel discipline, not an optional extra. With two-thirds of US Google searches ending without a click and AI assistants sending real, measurable referral traffic to sites that answer questions with structured, checkable data, the content that wins in both channels looks the same: specific, sourced, and built around topical authority and E-E-A-T rather than volume for its own sake.

Sources

Related Articles

If you want your own site's numbers checked against the real data here rather than the industry average, get in touch or run the free website grader first.

Benchmark your own numbers

Put your own numbers against these benchmarks

These statistics show the market. The next step is checking where your own site sits against them. Run your numbers through the free ROI calculator, or get the £495 audit for a full diagnosis of what is holding you back.

Get Started

Ready to grow your organic traffic?

Request a free 20-minute SEO diagnosis: focus on the biggest issue and the most useful next step.

Request Free Diagnosis
15+ years experienceFree 20-minute diagnosisNo contracts

Usually responds within a few hours