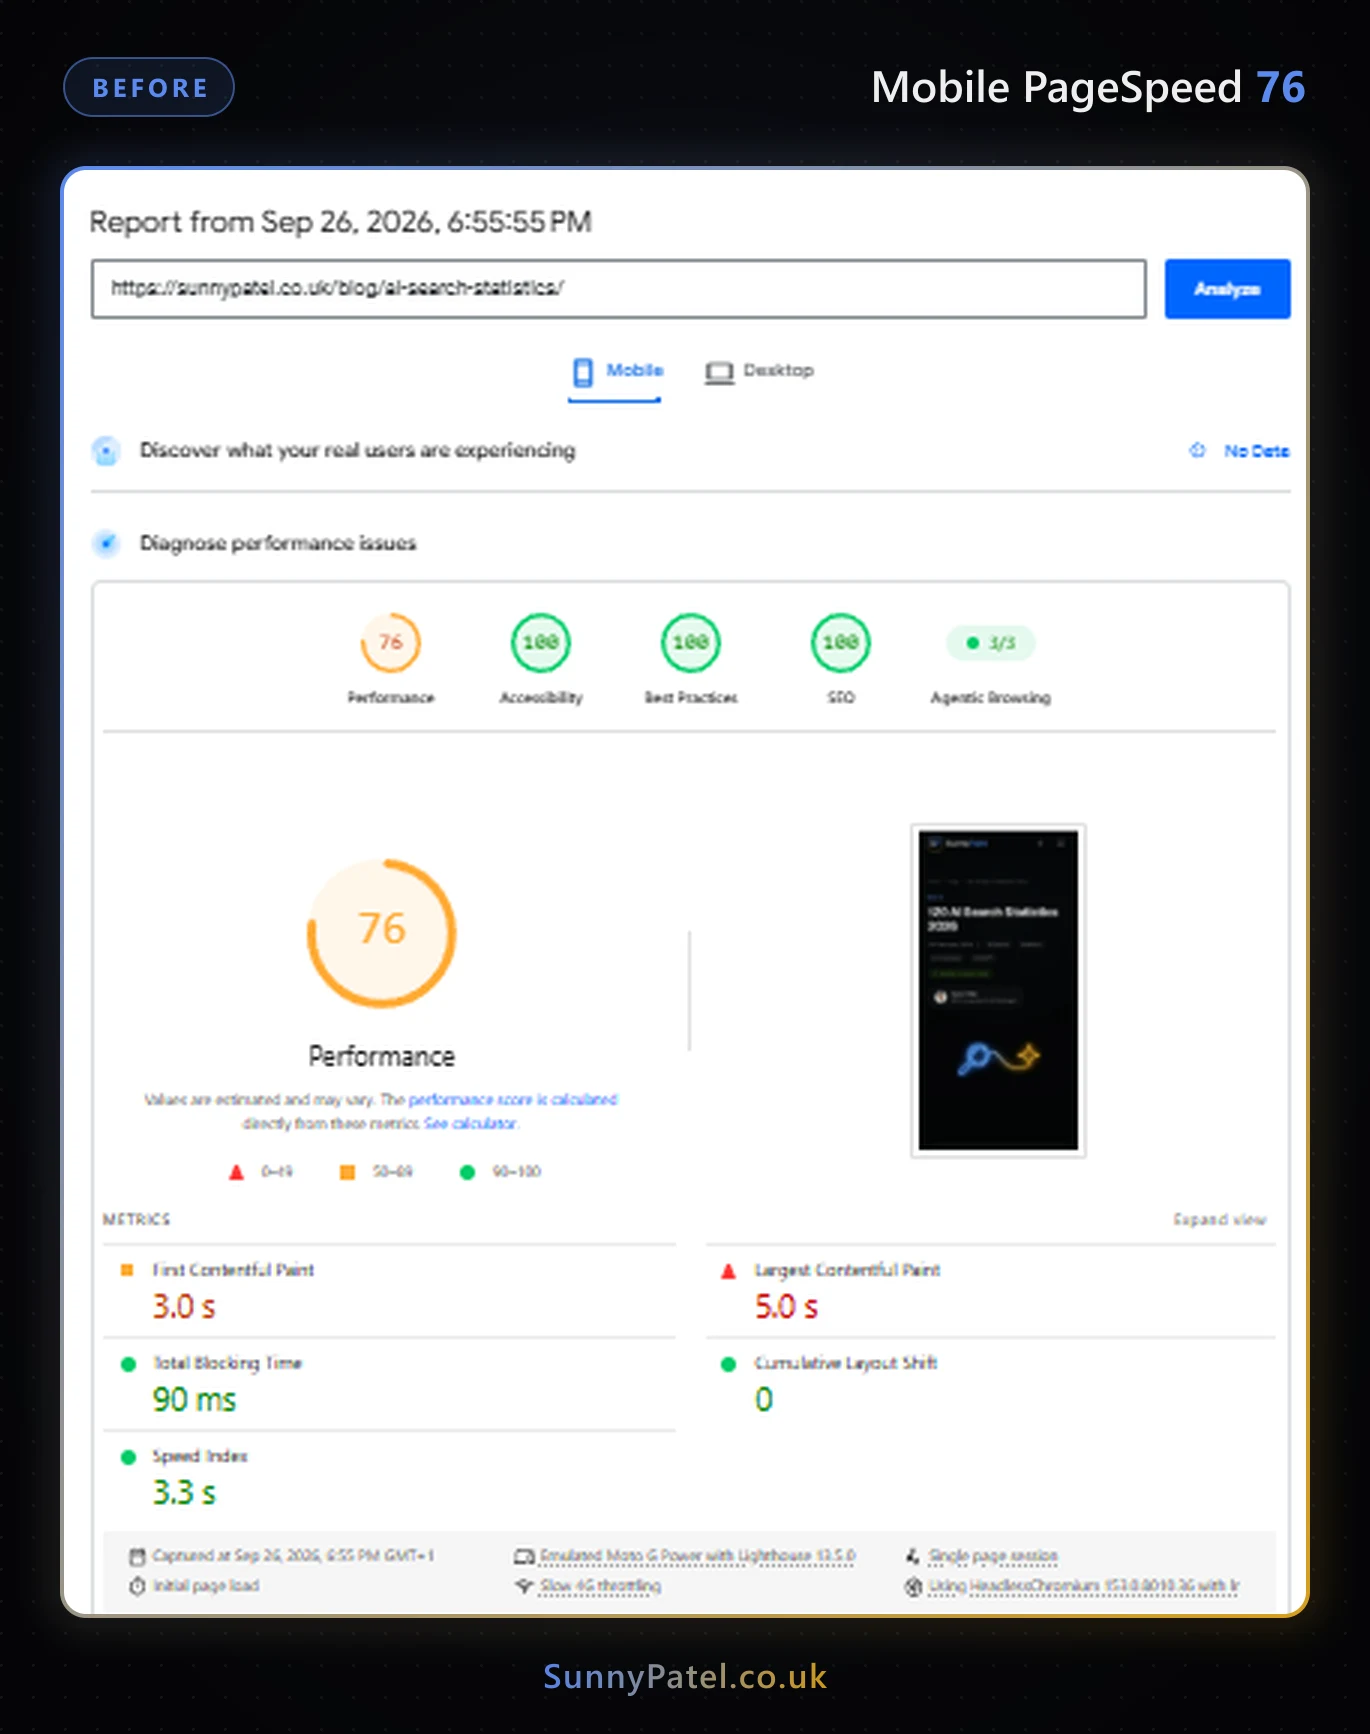
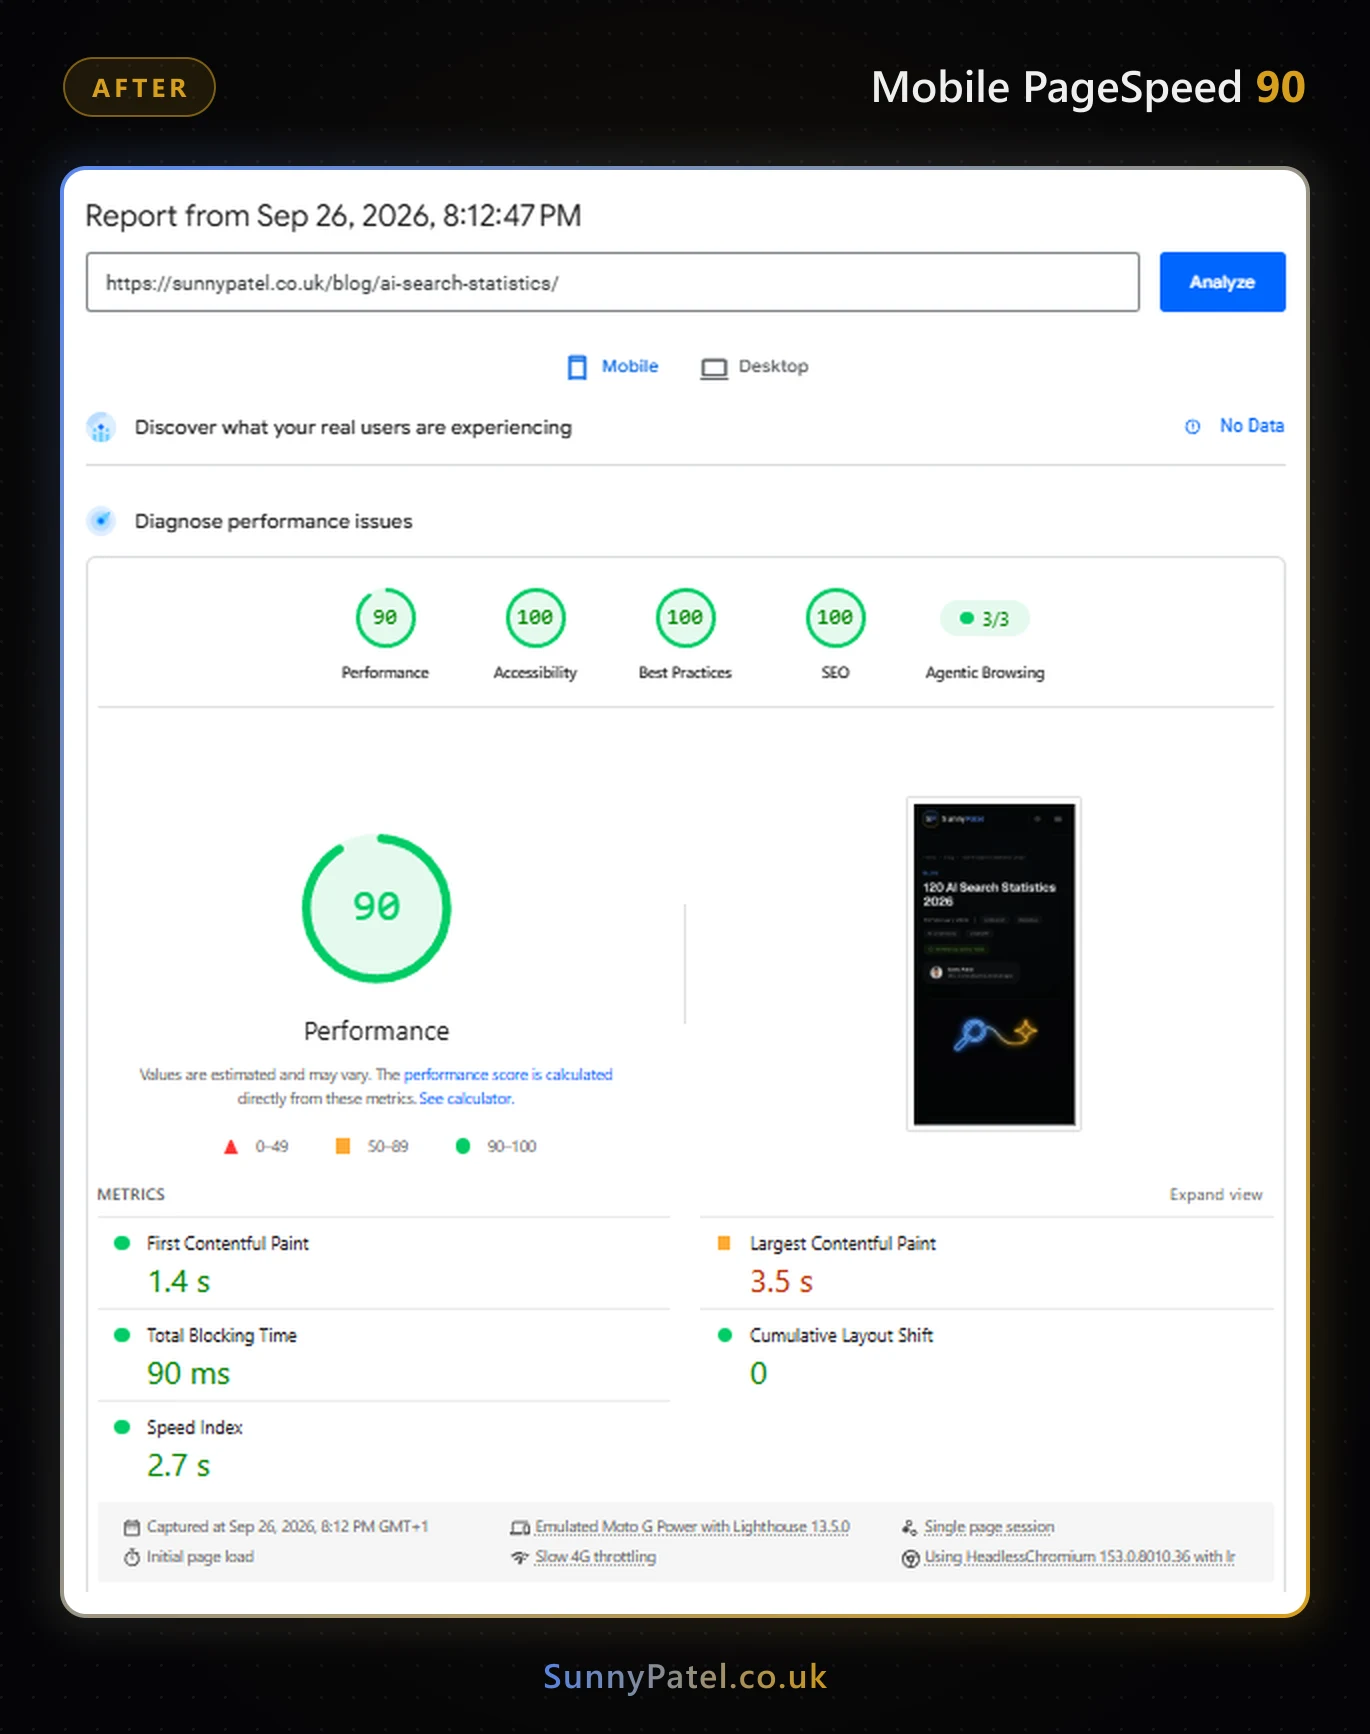
The page: a 120-statistic Next.js article
My AI search statistics article is one of my linkable asset pages. It carries 120 sourced figures, interactive charts, stat tiles and pull quotes, all wrapped in the glowing card style used across this site. On 24 and 25 September 2026 I shipped a batch of those charts plus a light theme, and the page looked the way I wanted it to.
On the evening of 26 September I ran 120 AI Search Statistics 2026 through PageSpeed Insights. Desktop scored 100. Mobile scored 76.
What slowed the mobile PageSpeed score
PageSpeed simulates a mid-range phone on a slow 4G connection, so anything that competes for bandwidth or the main thread early on gets punished. The mobile report showed:
- First Contentful Paint: 3.0s. Nothing appeared on screen for three seconds.
- Largest Contentful Paint: 5.0s. The hero image was the largest element and it painted last.
- Total Blocking Time: 90ms and Cumulative Layout Shift: 0. The page wasn't janky or jumpy. It was slow to start.
I rebuilt the page locally and ran Lighthouse three times to get a stable baseline (75, 76, 76). Then I went through the network waterfall and main-thread breakdown line by line. Four things stood out.
- Google Analytics was the biggest file on the page. The gtag script is about 161 KB, and because it loaded as soon as the page became interactive, Next.js added a preload for it in the page head. On a slow connection, that preload was fighting the CSS and fonts for bandwidth before anything had painted.
- The table of contents shipped an animation library up front. The floating "On this page" menu uses Motion for its slide-in. It renders nothing until the browser has measured the headings, yet its code was in the initial bundle.
- Every glow card was listening to the mouse. Each card's hover ring attached scroll and pointer listeners on load and imported Motion to animate the ring. The page has 13 of these cards, and the listeners stayed attached for cards far off screen.
- The hero image was fetched at low priority. It was preloaded, but without
fetchpriority="high"the browser queued it behind the scripts. Lighthouse flagged a 790ms render delay on the image.
Four load-order fixes
Each fix changes when, or in what order, something loads. The design stayed exactly as it was.
- Analytics loads after the page. gtag.js now uses the
lazyOnloadstrategy. The small inline config still runs early, so the pageview queues in the data layer and sends as soon as the library arrives. The trade-off: a visitor who leaves within the first second or so may not be counted. - The table of contents loads client-side only. It now comes in through
next/dynamicwith server rendering switched off. Since it rendered nothing on the server anyway, the visible result is identical, and Motion drops out of the first-load JavaScript. - The hover glow wakes up on demand. Motion is imported the first time a pointer comes near a card, and each card only listens for movement while it's on or near the screen. Phones don't hover, so on a mobile first load that code isn't downloaded at all.
- The hero image is marked high priority. The shared themed image component now adds
fetchpriority="high"whenever an image is flagged as the priority hero, so every blog and service hero gets the same fix.
I also tried content-visibility: auto on the glow cards so the browser could skip rendering off-screen figures. It made the scores worse and much less consistent (67 to 84 across runs), so I reverted it. Worth testing, and worth measuring before you keep it.
Result: mobile PageSpeed 76 to 90
The local Lighthouse median went from 76 to 83 after the first three fixes, then 84 with the hero priority change. Once the build was live, PageSpeed Insights scored the page 90 on mobile (the After report at the top of this page):
- First Contentful Paint: 1.4s (was 3.0s)
- Largest Contentful Paint: 3.5s (was 5.0s)
- Speed Index: 2.7s (was 3.3s)
- Total Blocking Time: 90ms (unchanged)
- Cumulative Layout Shift: 0 (unchanged)
Accessibility, Best Practices and SEO stayed at 100. I checked in a real browser that the hover glow, the table of contents and the hero image still behave as before.
The remaining LCP lever: inline page data
The page ships about 240 KB of inline page data for its 1,600 or so HTML elements, which is what keeps Largest Contentful Paint at 3.5s. Trimming that means restructuring how the charts pass their data, a bigger job than one evening. It's the next lever if the page needs to go further.
Does a higher PageSpeed score help rankings?
Not directly. PageSpeed scores are lab numbers, and Google's page experience signals use field data from real Chrome users. This page doesn't have enough traffic for field data yet, so the score itself isn't moving rankings today. The fixes are still worth having: faster first paint means fewer people bounce before the page appears, and the shared image and analytics changes apply across every page on the site.
If your site slowed down after a redesign and you'd rather not give up the design to fix it, a technical SEO audit is where I'd start.