Growth on the health affiliate site before the drop
Google Search Console recorded 174 clicks for my health affiliate site in April 2026, 104 in May and 476 in June. I'm Sunny Patel, and I own and run the site. The extract was pulled on 4 October 2026 and begins on 22 March 2026. Google clicks were 24 in the last ten days of March, and daily clicks peaked at 41 on 25 June. From 1 to 19 July the site averaged about 19 clicks a day.
Google impressions
| Google impressions | Value |
|---|---|
| 22 to 31 Mar | 3,645 |
| Apr | 26,547 |
| May | 32,153 |
| Jun | 44,193 |
| 1 to 19 Jul | 27,956 |
Source: Google Search Console via SEO Gets, 22 March to 19 July 2026, pulled 4 Oct 2026
Google impressions for the health affiliate site rose from 3,645 in the last ten days of March to 44,193 in June 2026. The first and last bars cover part-months, 10 and 19 days, so they are not comparable with the full months between them. May was lower than April on clicks (104 against 174) even though impressions were higher, so the growth was not a straight line.
The 20 July drop in Google impressions
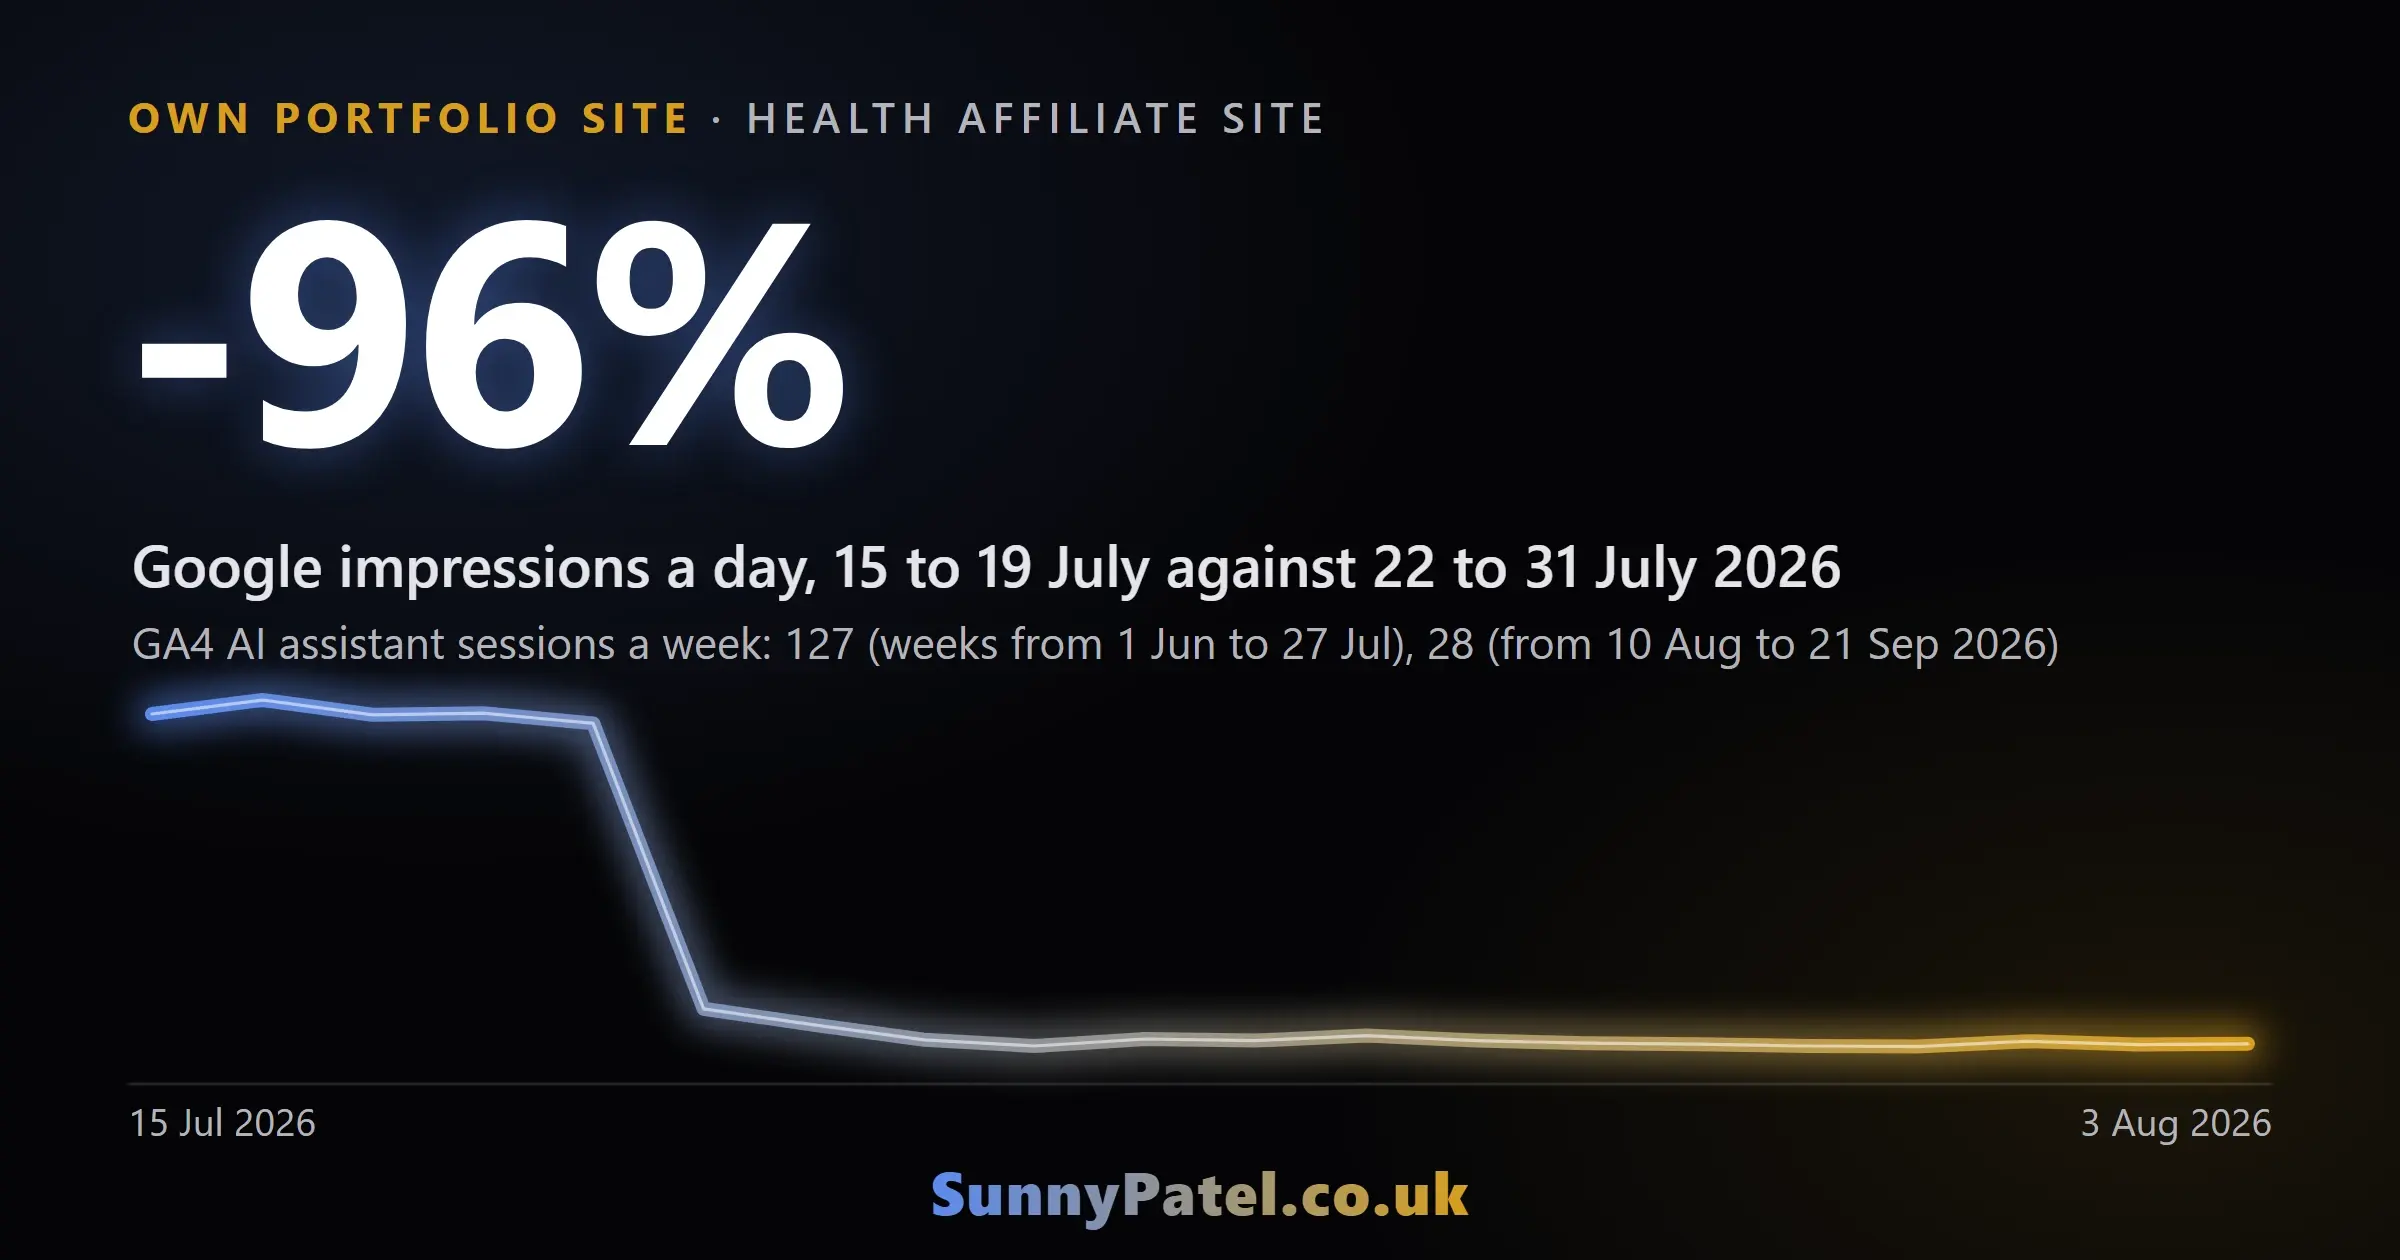
The health affiliate site's Google impressions began falling on 20 July 2026. Search Console recorded an average of about 1,630 impressions a day on 15 to 19 July and 66 a day on 22 to 31 July, a 96% decline between those two periods. The single-day move was smaller but still large, from 1,583 impressions on 19 July to 225 on 20 July and 148 on 21 July. Daily Google clicks averaged about 21 over the first period and about 1 over the second.
Google impressions
| Google impressions | Value |
|---|---|
| 15 Jul | 1,627 |
| 16 Jul | 1,694 |
| 17 Jul | 1,624 |
| 18 Jul | 1,631 |
| 19 Jul | 1,583 |
| 20 Jul | 225 |
| 21 Jul | 148 |
| 22 Jul | 77 |
| 23 Jul | 48 |
| 24 Jul | 81 |
| 25 Jul | 73 |
| 26 Jul | 97 |
| 27 Jul | 73 |
| 28 Jul | 61 |
| 29 Jul | 56 |
| 30 Jul | 48 |
| 31 Jul | 45 |
| 1 Aug | 70 |
| 2 Aug | 54 |
| 3 Aug | 58 |
Source: Google Search Console via SEO Gets, 15 July to 3 August 2026, pulled 4 Oct 2026
I removed the unsupported author and testing claims and redirected duplicate pages on 2 and 3 August 2026, after the Google decline began, so those changes cannot have caused it.
Search Console recorded two earlier one-to-two-day dips on the health affiliate site, on 4 to 5 July and 12 to 13 July 2026, and both recovered within a day or two. The 20 July fall had not recovered by 30 September, the last date in the extract. August 2026 totalled 1,870 impressions and 15 clicks, and September 2026 totalled 1,032 impressions and 11 clicks, against 44,193 impressions and 476 clicks in June.
The decline differed across the search engines measured in GA4. Comparing 6 to 19 July with 20 July to 2 August 2026, Google organic sessions on the health affiliate site fell from 344 to 41, while Bing organic sessions rose from 308 to 444, DuckDuckGo from 464 to 652 and Yahoo from 149 to 234. AI assistant sessions fell later, beginning in the week of 3 August, as the next section shows.
AI referrals to the health affiliate site over the same period
GA4 assistant-attributed sessions on the health affiliate site began falling in the week starting 3 August 2026, about two weeks after the Google impression decline began on 20 July. From the week starting 1 June to the week starting 27 July, GA4 attributed between 101 and 144 sessions a week to AI assistants, an average of 127. In the week starting 3 August the figure was 78, then 42, 34 and 21, and from the week starting 10 August to the week starting 21 September it averaged 28 a week, 78% lower than before. A session here is a recorded visit. The weekly report matches these GA4 source names: chatgpt.com, openai, perplexity, perplexity.ai, claude.ai, copilot.com, gemini and gemini.google.com. The averages use complete Monday-to-Sunday weeks in the property's America/Los_Angeles timezone.
AI assistant sessions
| AI assistant sessions | Value |
|---|---|
| 1 Jun | 112 |
| 8 Jun | 142 |
| 15 Jun | 128 |
| 22 Jun | 131 |
| 29 Jun | 144 |
| 6 Jul | 134 |
| 13 Jul | 101 |
| 20 Jul | 118 |
| 27 Jul | 136 |
| 3 Aug | 78 |
| 10 Aug | 42 |
| 17 Aug | 34 |
| 24 Aug | 21 |
| 31 Aug | 28 |
| 7 Sep | 23 |
| 14 Sep | 23 |
| 21 Sep | 22 |
Source: GA4, 1 June to 27 September 2026, pulled 4 Oct 2026
The first lower weekly total covers 3 to 9 August 2026, overlapping the changes I made on 2 and 3 August. The weekly data does not establish whether those changes contributed to the decline, and it does not show which day the decline began. Monthly assistant-attributed sessions were 553 in June, 556 in July, 214 in August and 98 in September 2026, so the assistants did not hold up either. They fell later than Google.
Over the 91 days from 3 July to 1 October 2026, GA4 attributed 824 sessions on the health affiliate site to AI assistants: ChatGPT and OpenAI labels 641, Perplexity 88, Copilot 58 and Claude 37. The ChatGPT figure combines 637 sessions from chatgpt.com with 4 labelled openai, which GA4 does not confirm came from ChatGPT. I counted sessions matching the selected ChatGPT or OpenAI, Perplexity, Copilot and Claude source labels, including matching rows with an unset or referral medium. The total excludes seven sessions from other assistant-style sources (Tencent, Alibaba and Doubao labels). The weekly report uses the GA4 property's America/Los_Angeles timezone and complete Monday-to-Sunday weeks. Google organic search sent 480 sessions in the same window.
AI assistant sessions
| AI assistant sessions | Value |
|---|---|
| ChatGPT or OpenAI | 641 sessions |
| Perplexity | 88 sessions |
| Copilot | 58 sessions |
| Claude | 37 sessions |
Source: GA4, 3 July to 1 October 2026, pulled 4 Oct 2026
These are visits attributed by GA4 to assistant sources. They are not citation counts or measures of answer visibility, and this case study contains no test of whether assistants stopped linking to the health affiliate site or which pages they linked to.
What I have and have not fixed on the health affiliate site
On 2 and 3 August 2026 I made two changes to the health affiliate site. I removed an invented expert author byline and the first-hand testing claims attached to it, which I could not support, and I set the structured data author to the organisation. I also redirected 12 near-duplicate condition pages into the main set of condition pages.
Neither change has brought Google impressions back. September 2026 impressions were 1,032 against 44,193 in June. My 2 August 2026 diagnostic record reports no manual action in Search Console. That is the dated check available for this case study, and it does not establish the current manual-action status or the cause of the traffic decline.
I have not established why Google traffic fell. The unsupported author and testing claims were defects I could correct, but their existence does not prove that Google demoted the site for those reasons. The cause is not confirmed. The work recorded here covers the author claims and duplicate pages, and these records do not establish that every remaining health claim and source has been reviewed. My August remediation record paused a planned set of new product pages pending recovery.
The September Search Console figures show no recovery. This case study contains no verified revenue result. It describes one site in one niche, and results vary by niche and starting point.
Questions about these results
Has the health affiliate site recovered in Google?
No. Google Search Console shows 1,032 impressions and 11 clicks for the health affiliate site in September 2026, against 44,193 impressions and 476 clicks in June 2026. The extract ends on 30 September 2026, 72 days after the fall began on 20 July, and it shows no sign of recovery.
Did removing the author byline and redirecting pages cause the fall in the health affiliate site's AI assistant visits?
The effect of those changes on the health affiliate site's assistant-attributed sessions is not established. GA4's weekly report first shows a lower total for 3 to 9 August 2026. I made the site changes on 2 and 3 August, but this uncontrolled comparison cannot establish their effect, and the weekly data cannot place the start of the decline on a particular day.
Did the Google demotion cause the fall in the health affiliate site's AI assistant visits?
This case study does not establish that the Google decline on the health affiliate site caused the fall in its AI referrals. Google impressions fell from 20 July 2026, and GA4 assistant-attributed sessions fell from the week starting 3 August. The later decline also overlapped my site changes, so I cannot attribute it to either event. I would measure Google, other search engines and AI assistant sessions separately on any site.
Was this a Google penalty?
My 2 August 2026 diagnostic record reports no manual action in Search Console. That record does not establish the cause of the traffic decline or the site's current manual-action status. The July comparison shows falling Google organic sessions while Bing, DuckDuckGo and Yahoo organic sessions rose. I use "demotion" here to describe the sustained loss of Google search traffic. Its cause remains unconfirmed.
If you want your own traffic checked for a pattern like this, start with a free 20-minute SEO diagnosis. The six-site AI visibility results show what assistant-attributed sessions look like across other sectors.